Elmore County, Idaho: Sunbelt Conservative county. In 2024, voted R+49%. Democratic peak: D+62 in 1896.
Key facts
- 2024 presidential margin
- R+49MIT Election Lab
- Political typology
- Sunbelt ConservativeAkashic typology
- Population
- 29,3212024 5-year
- Median household income
- $65,3592024 5-year
- White (non-Hispanic)
- 72.7%2024 5-year
- Black
- 3.2%2024 5-year
- Hispanic / Latino
- 18.2%2024 5-year
- Peak Democratic margin
- D+62 in 1896MIT Election Lab
- Peak Republican margin
- R+51 in 1984MIT Election Lab
- Most similar
- Camas County, ID · similarity 1.00
| Donald Trump ✓Republican | 73.0% | 7,791 |
|---|---|---|
| Kamala HarrisDemocratic | 24.5% | 2,611 |
| OtherAll other candidates | 2.5% | 270 |
| Year | Margin (D minus R) |
|---|---|
| 1876 | No data |
| 1880 | No data |
| 1884 | No data |
| 1888 | No data |
| 1892 | −34.8% |
| 1896 | +62.3% |
| 1900 | +18.0% |
| 1904 | −14.3% |
| 1908 | −0.1% |
| 1912 | +7.9% |
| 1916 | +24.1% |
| 1920 | −10.2% |
| 1924 | −19.7% |
| 1928 | −20.6% |
| 1932 | +33.0% |
| 1936 | +36.9% |
| 1940 | +20.5% |
| 1944 | +22.4% |
| 1948 | +29.4% |
| 1952 | −5.4% |
| 1956 | −2.5% |
| 1960 | +4.6% |
| 1964 | +10.9% |
| 1968 | −18.0% |
| 1972 | −41.6% |
| 1976 | −12.7% |
| 1980 | −36.3% |
| 1984 | −51.4% |
| 1988 | −28.3% |
| 1992 | −17.8% |
| 1996 | −19.5% |
| 2000 | −43.8% |
| 2004 | −50.3% |
| 2008 | −36.4% |
| 2012 | −33.9% |
| 2016 | −47.0% |
| 2020 | −45.5% |
| 2024 | −48.5% |
| Year | Won | Margin | Democratic | Republican | Total |
|---|---|---|---|---|---|
| R | 2,611 | 7,791 | 10,672 | ||
| R | 2,601 | 7,246 | 10,205 | ||
| R | 1,814 | 5,816 | 8,519 | ||
| R | 2,513 | 5,227 | 8,001 | ||
| R | 2,591 | 5,665 | 8,436 | ||
| R | 1,959 | 6,011 | 8,061 | ||
| R | 1,840 | 4,891 | 6,966 | ||
| R | 2,324 | 3,668 | 6,904 | ||
| R | 1,858 | 3,087 | 6,890 | ||
| R | 2,078 | 3,756 | 5,919 | ||
| R | 1,458 | 4,595 | 6,105 | ||
| R | 1,760 | 3,994 | 6,157 | ||
| R | 2,164 | 2,808 | 5,063 | ||
| R | 1,153 | 3,078 | 4,625 | ||
| R | 1,230 | 1,908 | 3,769 | ||
| D | 2,310 | 1,857 | 4,167 | ||
| D | 2,440 | 2,226 | 4,666 | ||
| R | 1,759 | 1,849 | 3,608 | ||
| R | 1,484 | 1,653 | 3,139 | ||
| D | 1,589 | 854 | 2,503 | ||
| D | 1,627 | 1,030 | 2,667 | ||
| D | 1,632 | 1,077 | 2,713 | ||
| D | 1,567 | 688 | 2,380 | ||
| D | 1,615 | 794 | 2,486 | ||
| R | 739 | 1,125 | 1,877 | ||
| O | 381 | 789 | 2,076 | ||
| R | 867 | 1,065 | 1,932 | ||
| D | 1,104 | 658 | 1,852 | ||
| O | 536 | 415 | 1,532 | ||
| R | 660 | 662 | 1,562 | ||
| R | 433 | 593 | 1,117 | ||
| D | 565 | 393 | 958 | ||
| D | 535 | 124 | 660 | ||
| O | 0 | 188 | 540 | ||
| — | — | — | — | ||
| — | — | — | — | ||
| — | — | — | — | ||
| — | — | — | — |
Demographics
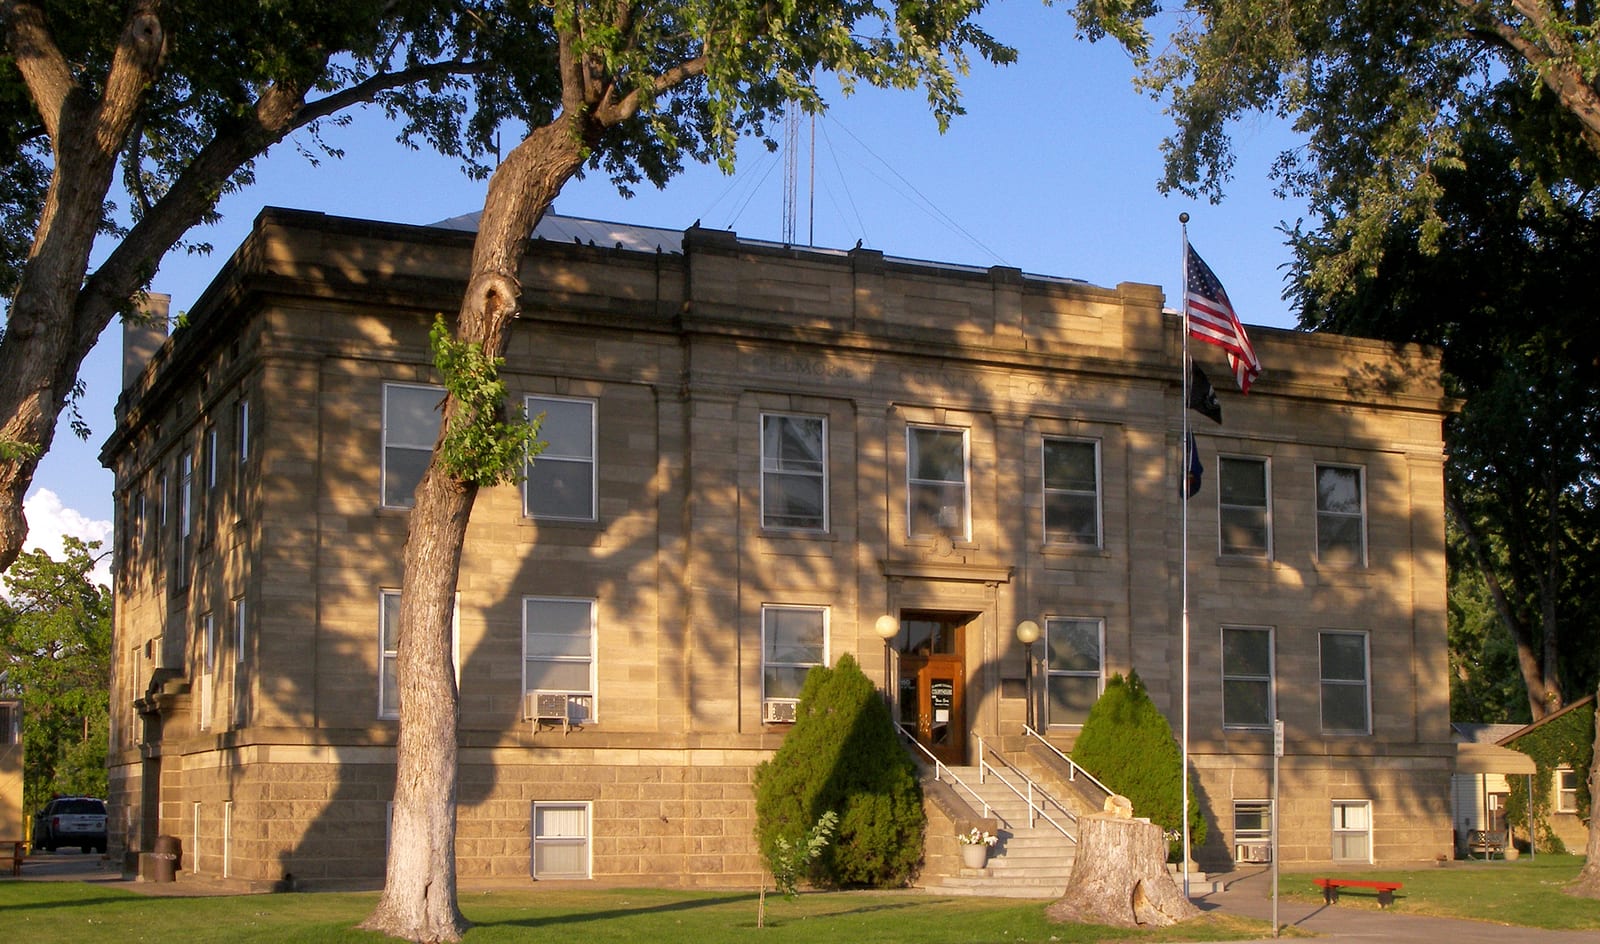
Elmore County, anchored by Mountain Home and its Air Force base, delivers some of the widest Republican presidential margins in the state, with 2024's R+48.7 gap reflecting a rural electorate that has grown more consolidated over successive cycles.
The Republican margin here reached fifty-one points in 1984. Between 2020 and 2024 the county moved three points toward the Republican candidate; the 2024 margin was forty-nine points.
A median household income of $65,359, a 73% non-Hispanic-white share, and a population of 29,321 describe the county. The county's voting pattern over the last decade is most similar to that of Camas County and Scotts Bluff County.
Compare two places, side by side
Twelve curated comparisons line up election history, demographics, and the divergence story for two places at a glance. Browse all comparisons →
Elmore County, Idaho. Akashic. https://akashic.app/county/16039/. Accessed May 20, 2026. License: CC BY 4.0.