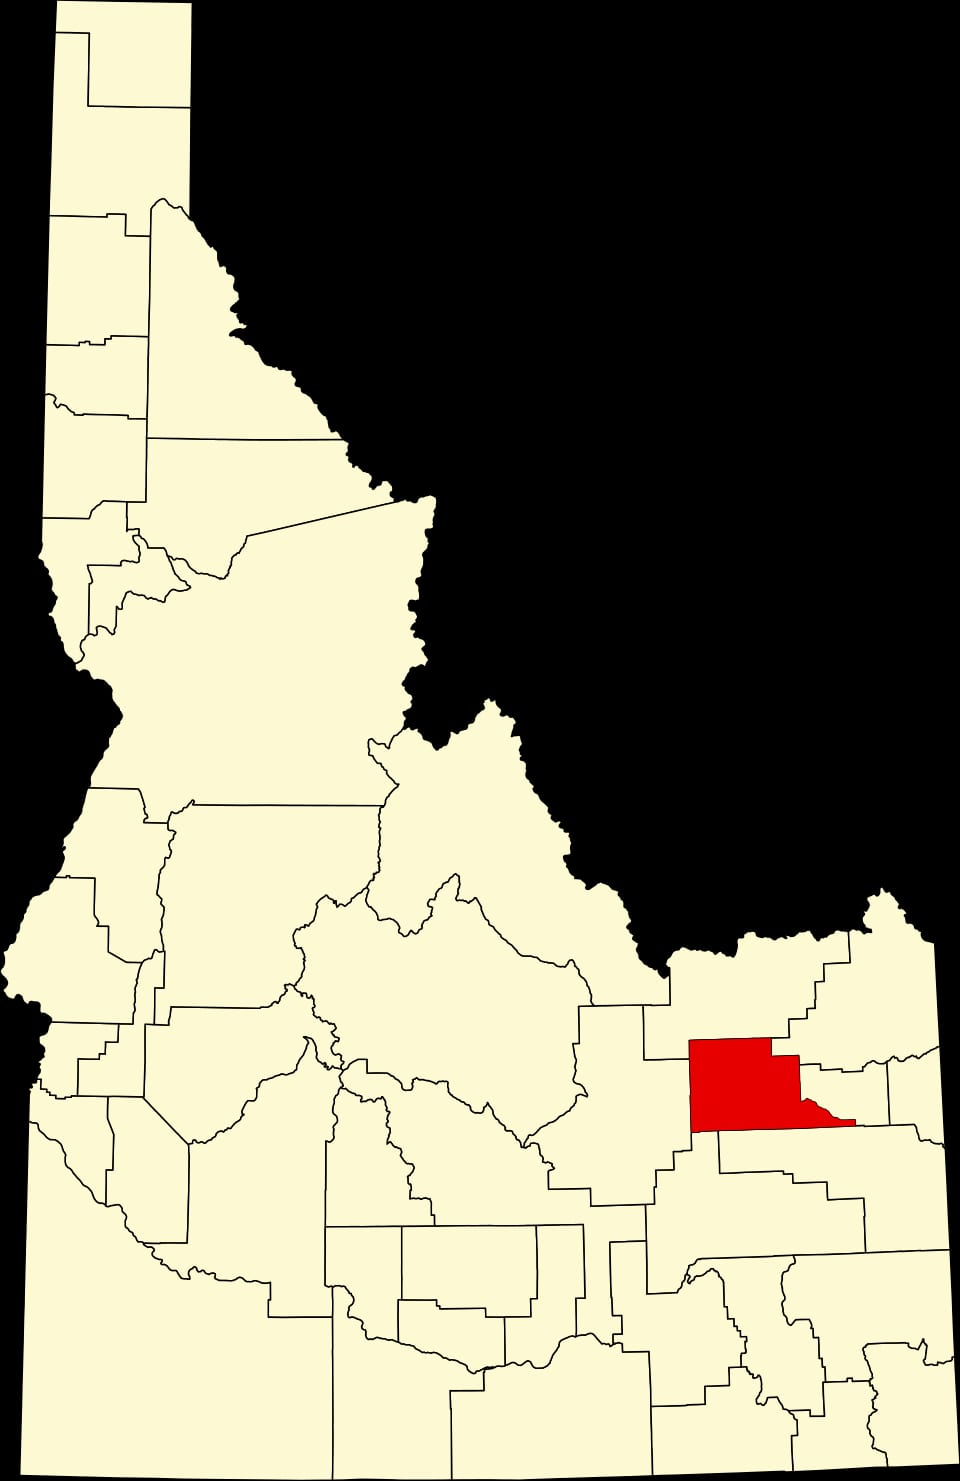
Jefferson County, Idaho: Sunbelt Conservative county. In 2024, voted R+73%. Republican peak: R+77 in 1984.
Key facts
- 2024 presidential margin
- R+73MIT Election Lab
- Political typology
- Sunbelt ConservativeAkashic typology
- Population
- 33,1542024 5-year
- Median household income
- $86,6792024 5-year
- White (non-Hispanic)
- 87.5%2024 5-year
- Black
- 0.1%2024 5-year
- Hispanic / Latino
- 11.0%2024 5-year
- Peak Democratic margin
- D+45 in 1936MIT Election Lab
- Peak Republican margin
- R+77 in 1984MIT Election Lab
- Most similar
- Cassia County, ID · similarity 1.00
| Donald Trump ✓Republican | 85.2% | 13,481 |
|---|---|---|
| Kamala HarrisDemocratic | 12.0% | 1,891 |
| OtherAll other candidates | 2.8% | 447 |
| Year | Margin (D minus R) |
|---|---|
| 1876 | No data |
| 1880 | No data |
| 1884 | No data |
| 1888 | No data |
| 1892 | No data |
| 1896 | No data |
| 1900 | No data |
| 1904 | No data |
| 1908 | No data |
| 1912 | No data |
| 1916 | +22.5% |
| 1920 | −41.5% |
| 1924 | −39.1% |
| 1928 | −10.6% |
| 1932 | +35.5% |
| 1936 | +45.0% |
| 1940 | +20.9% |
| 1944 | +20.2% |
| 1948 | +14.8% |
| 1952 | −33.6% |
| 1956 | −20.2% |
| 1960 | −5.0% |
| 1964 | −14.1% |
| 1968 | −41.4% |
| 1972 | −44.4% |
| 1976 | −33.6% |
| 1980 | −72.5% |
| 1984 | −76.6% |
| 1988 | −61.6% |
| 1992 | −35.0% |
| 1996 | −47.3% |
| 2000 | −68.7% |
| 2004 | −74.3% |
| 2008 | −66.1% |
| 2012 | −75.5% |
| 2016 | −65.0% |
| 2020 | −73.6% |
| 2024 | −73.3% |
| Year | Won | Margin | Democratic | Republican | Total |
|---|---|---|---|---|---|
| R | 1,891 | 13,481 | 15,819 | ||
| R | 1,661 | 12,099 | 14,173 | ||
| R | 976 | 8,436 | 11,471 | ||
| R | 1,303 | 9,895 | 11,381 | ||
| R | 1,641 | 8,540 | 10,441 | ||
| R | 1,084 | 7,703 | 8,906 | ||
| R | 1,100 | 6,480 | 7,836 | ||
| R | 1,427 | 4,925 | 7,403 | ||
| R | 978 | 3,471 | 7,116 | ||
| R | 1,198 | 5,295 | 6,649 | ||
| R | 743 | 5,770 | 6,563 | ||
| R | 833 | 5,860 | 6,933 | ||
| R | 1,745 | 3,599 | 5,525 | ||
| R | 715 | 2,983 | 5,110 | ||
| R | 955 | 2,927 | 4,761 | ||
| R | 2,061 | 2,740 | 4,801 | ||
| R | 2,374 | 2,625 | 4,999 | ||
| R | 1,823 | 2,748 | 4,571 | ||
| R | 1,474 | 2,970 | 4,446 | ||
| D | 2,017 | 1,490 | 3,568 | ||
| D | 2,198 | 1,458 | 3,665 | ||
| D | 2,631 | 1,717 | 4,364 | ||
| D | 2,776 | 1,037 | 3,864 | ||
| D | 2,501 | 1,177 | 3,732 | ||
| R | 1,350 | 1,671 | 3,028 | ||
| R | 305 | 1,393 | 2,782 | ||
| R | 741 | 1,794 | 2,535 | ||
| D | 1,606 | 993 | 2,725 | ||
| — | — | — | — | ||
| — | — | — | — | ||
| — | — | — | — | ||
| — | — | — | — | ||
| — | — | — | — | ||
| — | — | — | — | ||
| — | — | — | — | ||
| — | — | — | — | ||
| — | — | — | — | ||
| — | — | — | — |
Demographics
Jefferson County's 2024 presidential margin of R+73.2 ranks among the widest in the state, reflecting a predominantly rural, agricultural population with little urban counterweight to the region's strong Republican lean.
The Republican margin here reached seventy-seven points in 1984. The 2024 margin was seventy-three points.
A median household income of $86,679, a 88% non-Hispanic-white share, and a population of 33,154 describe the county. The county's voting pattern over the last decade is most similar to that of Cassia County and Sevier County.
Compare two places, side by side
Twelve curated comparisons line up election history, demographics, and the divergence story for two places at a glance. Browse all comparisons →
Jefferson County, Idaho. Akashic. https://akashic.app/county/16051/. Accessed May 20, 2026. License: CC BY 4.0.