Nez Perce County, Idaho: Farm Belt county. In 2024, voted R+39%. Democratic peak: D+47 in 1936.
Key facts
- 2024 presidential margin
- R+39MIT Election Lab
- Political typology
- Farm BeltAkashic typology
- Population
- 42,6972024 5-year
- Median household income
- $72,5992024 5-year
- White (non-Hispanic)
- 87.7%2024 5-year
- Black
- 0.2%2024 5-year
- Hispanic / Latino
- 4.4%2024 5-year
- Peak Democratic margin
- D+47 in 1936MIT Election Lab
- Peak Republican margin
- R+44 in 1892MIT Election Lab
- Most similar
- Ferry County, WA · similarity 1.00
| Donald Trump ✓Republican | 68.1% | 13,707 |
|---|---|---|
| Kamala HarrisDemocratic | 29.4% | 5,928 |
| OtherAll other candidates | 2.5% | 497 |
| Year | Margin (D minus R) |
|---|---|
| 1876 | No data |
| 1880 | No data |
| 1884 | No data |
| 1888 | No data |
| 1892 | −44.2% |
| 1896 | +23.2% |
| 1900 | −0.4% |
| 1904 | −36.0% |
| 1908 | −13.7% |
| 1912 | +14.6% |
| 1916 | +19.5% |
| 1920 | −28.1% |
| 1924 | −19.6% |
| 1928 | −22.9% |
| 1932 | +38.7% |
| 1936 | +46.5% |
| 1940 | +27.1% |
| 1944 | +26.5% |
| 1948 | +27.7% |
| 1952 | −1.0% |
| 1956 | +6.7% |
| 1960 | +20.8% |
| 1964 | +40.5% |
| 1968 | +11.8% |
| 1972 | −9.6% |
| 1976 | +1.4% |
| 1980 | −5.9% |
| 1984 | −15.2% |
| 1988 | +4.8% |
| 1992 | +9.7% |
| 1996 | +4.9% |
| 2000 | −34.8% |
| 2004 | −25.6% |
| 2008 | −18.1% |
| 2012 | −20.9% |
| 2016 | −34.1% |
| 2020 | −33.6% |
| 2024 | −38.6% |
| Year | Won | Margin | Democratic | Republican | Total |
|---|---|---|---|---|---|
| R | 5,928 | 13,707 | 20,132 | ||
| R | 6,686 | 13,738 | 20,967 | ||
| R | 4,828 | 10,699 | 17,195 | ||
| R | 6,451 | 9,967 | 16,848 | ||
| R | 7,123 | 10,357 | 17,823 | ||
| R | 6,476 | 11,009 | 17,700 | ||
| R | 4,995 | 10,577 | 16,021 | ||
| D | 7,491 | 6,675 | 16,696 | ||
| D | 7,069 | 5,431 | 16,974 | ||
| D | 7,754 | 7,027 | 15,020 | ||
| R | 5,981 | 8,153 | 14,330 | ||
| R | 6,565 | 7,495 | 15,744 | ||
| D | 6,324 | 6,151 | 12,755 | ||
| R | 5,081 | 6,232 | 11,941 | ||
| D | 6,502 | 5,019 | 12,579 | ||
| D | 9,245 | 3,912 | 13,157 | ||
| D | 7,944 | 5,203 | 13,147 | ||
| D | 6,448 | 5,635 | 12,083 | ||
| R | 5,552 | 5,659 | 11,231 | ||
| D | 5,747 | 3,168 | 9,322 | ||
| D | 5,453 | 3,159 | 8,649 | ||
| D | 5,963 | 3,409 | 9,413 | ||
| D | 5,705 | 1,988 | 7,985 | ||
| D | 5,077 | 2,211 | 7,412 | ||
| R | 2,535 | 4,054 | 6,644 | ||
| R | 1,212 | 2,250 | 5,304 | ||
| R | 1,548 | 2,761 | 4,311 | ||
| D | 2,675 | 1,753 | 4,738 | ||
| D | 1,619 | 1,011 | 4,166 | ||
| R | 2,843 | 3,871 | 7,515 | ||
| R | 1,696 | 3,956 | 6,281 | ||
| R | 2,168 | 2,184 | 4,566 | ||
| D | 1,089 | 675 | 1,786 | ||
| O | 0 | 345 | 780 | ||
| — | — | — | — | ||
| — | — | — | — | ||
| — | — | — | — | ||
| — | — | — | — |
Demographics
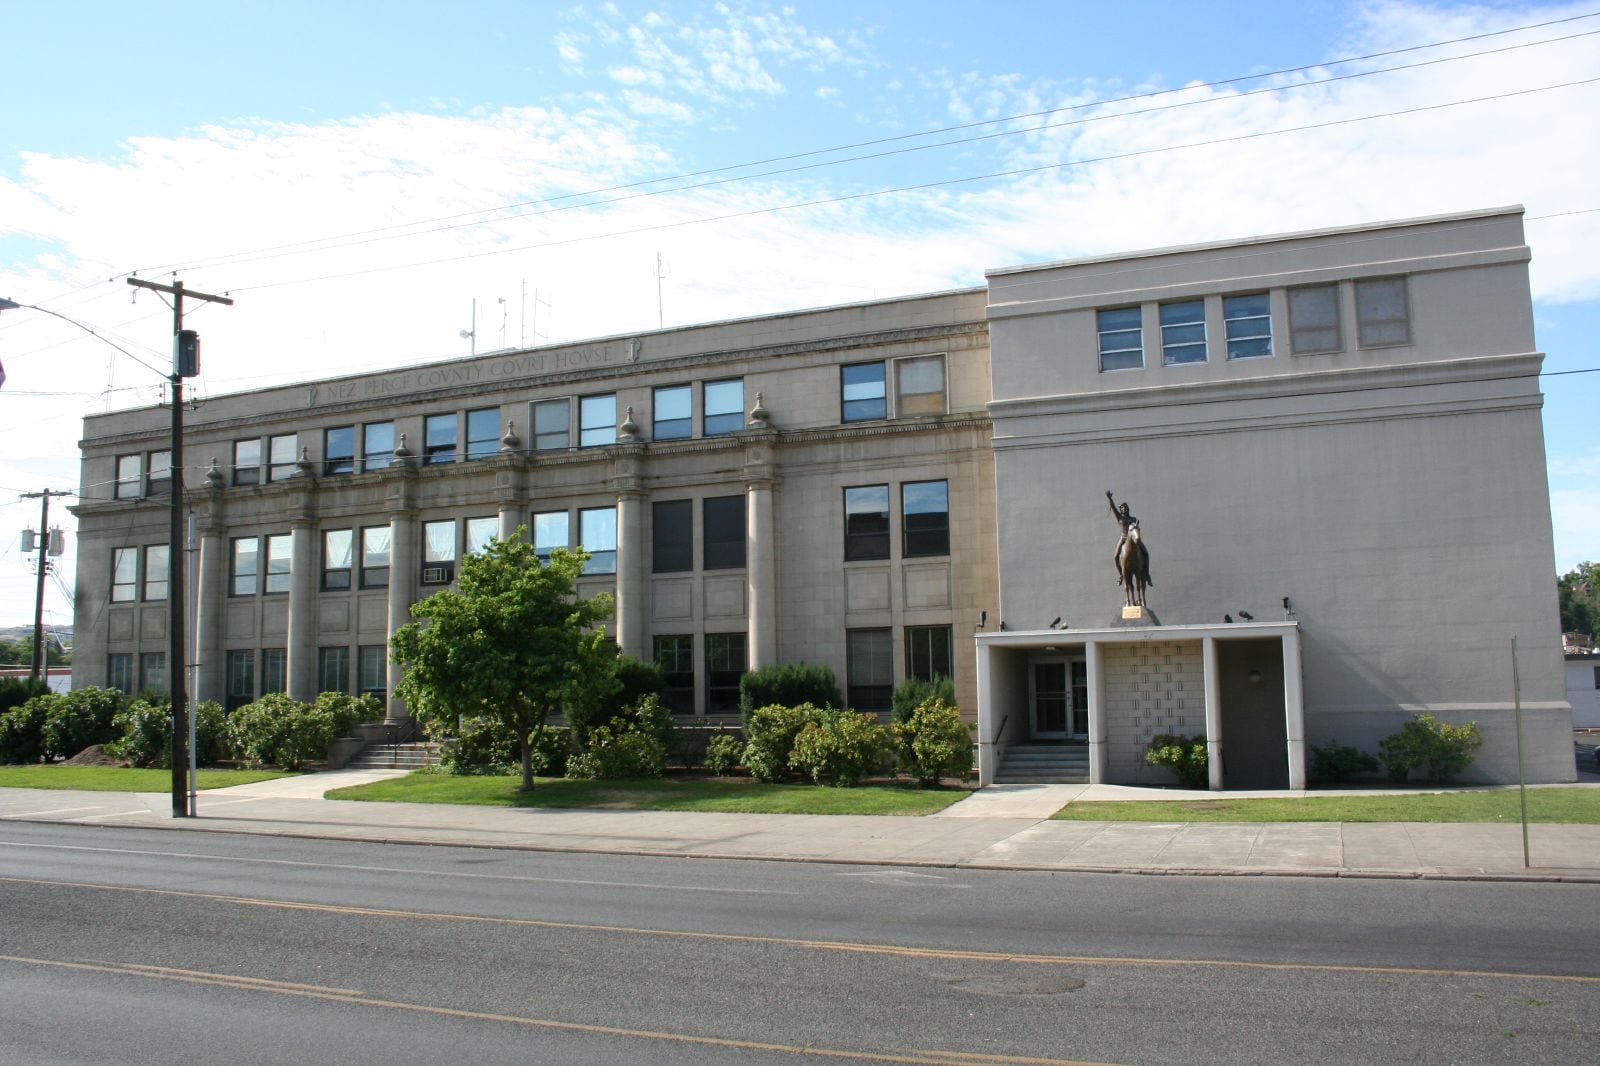
Nez Perce County sits along the Clearwater and Snake rivers in north-central Idaho, and despite hosting the regional hub of Lewiston, it has returned Republican presidential margins above 35 points in recent cycles — a pattern consistent with rural interior Northwest counties.
The Republican margin here reached forty-four points in 1892. Between 2020 and 2024 the county moved five points toward the Republican candidate; the 2024 margin was thirty-nine points.
A population of 42,697, a 88% non-Hispanic-white share, and a median household income of $72,599 describe an agricultural county. The county's voting pattern over the last decade is most similar to that of Ferry County and Clearwater County.
Compare two places, side by side
Twelve curated comparisons line up election history, demographics, and the divergence story for two places at a glance. Browse all comparisons →
Nez Perce County, Idaho. Akashic. https://akashic.app/county/16069/. Accessed May 20, 2026. License: CC BY 4.0.