Logan County, Illinois: Farm Belt county. In 2024, voted R+41%. Republican peak: R+42 in 1984.
Key facts
- 2024 presidential margin
- R+41MIT Election Lab
- Political typology
- Farm BeltAkashic typology
- Population
- 27,7132024 5-year
- Median household income
- $66,3582024 5-year
- White (non-Hispanic)
- 87.1%2024 5-year
- Black
- 5.4%2024 5-year
- Hispanic / Latino
- 3.5%2024 5-year
- Peak Democratic margin
- D+27 in 1912MIT Election Lab
- Peak Republican margin
- R+42 in 1984MIT Election Lab
- Most similar
- Menard County, IL · similarity 1.00
| Donald Trump ✓Republican | 69.7% | 8,757 |
|---|---|---|
| Kamala HarrisDemocratic | 28.2% | 3,543 |
| OtherAll other candidates | 2.1% | 264 |
| Year | Margin (D minus R) |
|---|---|
| 1876 | No data |
| 1880 | No data |
| 1884 | No data |
| 1888 | No data |
| 1892 | +8.6% |
| 1896 | −0.6% |
| 1900 | +2.3% |
| 1904 | −8.8% |
| 1908 | +1.3% |
| 1912 | +27.3% |
| 1916 | −1.7% |
| 1920 | −34.7% |
| 1924 | −27.2% |
| 1928 | −20.5% |
| 1932 | +16.1% |
| 1936 | +5.7% |
| 1940 | −13.8% |
| 1944 | −24.0% |
| 1948 | −21.1% |
| 1952 | −28.9% |
| 1956 | −33.3% |
| 1960 | −24.5% |
| 1964 | +6.2% |
| 1968 | −28.6% |
| 1972 | −40.0% |
| 1976 | −20.4% |
| 1980 | −40.1% |
| 1984 | −41.9% |
| 1988 | −28.3% |
| 1992 | −9.8% |
| 1996 | −15.4% |
| 2000 | −27.1% |
| 2004 | −35.9% |
| 2008 | −16.9% |
| 2012 | −32.0% |
| 2016 | −39.3% |
| 2020 | −39.7% |
| 2024 | −41.5% |
| Year | Won | Margin | Democratic | Republican | Total |
|---|---|---|---|---|---|
| R | 3,543 | 8,757 | 12,564 | ||
| R | 3,840 | 9,136 | 13,327 | ||
| R | 3,313 | 8,181 | 12,401 | ||
| R | 3,978 | 7,844 | 12,088 | ||
| R | 5,250 | 7,429 | 12,896 | ||
| R | 4,273 | 9,112 | 13,467 | ||
| R | 4,600 | 8,141 | 13,065 | ||
| R | 4,618 | 6,518 | 12,345 | ||
| R | 5,169 | 6,567 | 14,195 | ||
| R | 4,727 | 8,490 | 13,286 | ||
| R | 4,052 | 9,932 | 14,046 | ||
| R | 3,916 | 9,681 | 14,366 | ||
| R | 5,686 | 8,623 | 14,386 | ||
| R | 4,395 | 10,277 | 14,692 | ||
| R | 4,552 | 8,638 | 14,289 | ||
| D | 7,712 | 6,805 | 14,517 | ||
| R | 5,691 | 9,383 | 15,090 | ||
| R | 4,793 | 9,589 | 14,396 | ||
| R | 5,048 | 9,162 | 14,229 | ||
| R | 4,832 | 7,431 | 12,312 | ||
| R | 4,868 | 7,955 | 12,852 | ||
| R | 6,753 | 8,929 | 15,725 | ||
| D | 7,886 | 7,019 | 15,087 | ||
| D | 8,119 | 5,850 | 14,116 | ||
| R | 5,019 | 7,631 | 12,725 | ||
| R | 3,708 | 7,063 | 12,356 | ||
| R | 3,232 | 6,957 | 10,738 | ||
| R | 5,726 | 5,933 | 12,279 | ||
| D | 3,229 | 1,397 | 6,701 | ||
| D | 3,546 | 3,451 | 7,275 | ||
| R | 3,005 | 3,626 | 7,076 | ||
| D | 3,672 | 3,501 | 7,335 | ||
| R | 3,389 | 3,430 | 6,957 | ||
| D | 3,150 | 2,619 | 6,156 | ||
| — | — | — | — | ||
| — | — | — | — | ||
| — | — | — | — | ||
| — | — | — | — |
Demographics
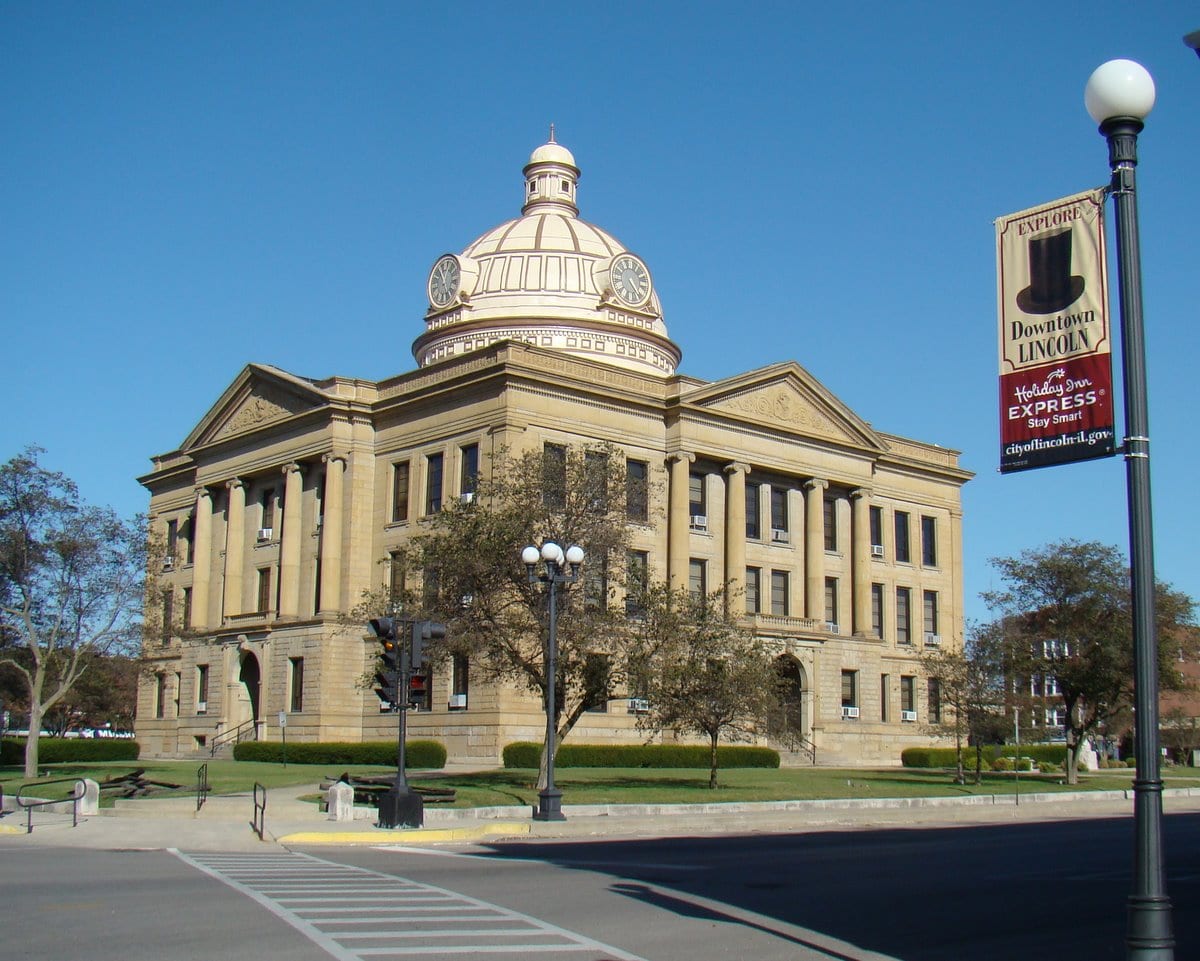
Logan County's small-city and rural mix — anchored by Lincoln, the county seat — has shifted steadily toward lopsided Republican margins over the past two decades, mirroring a broader realignment across downstate Illinois farming communities.
The Republican margin here reached forty-two points in 1984. Between 2020 and 2024 the county moved two points toward the Republican candidate; the 2024 margin was forty-one points.
A population of 27,713, a 87% non-Hispanic-white share, and a median household income of $66,358 describe an agricultural county. The county's voting pattern over the last decade is most similar to that of Menard County and Whitley County.
Compare two places, side by side
Twelve curated comparisons line up election history, demographics, and the divergence story for two places at a glance. Browse all comparisons →
Logan County, Illinois. Akashic. https://akashic.app/county/17107/. Accessed May 20, 2026. License: CC BY 4.0.