Massac County, Illinois: Farm Belt county. In 2024, voted R+49%. Republican peak: R+68 in 1920.
Key facts
- 2024 presidential margin
- R+49MIT Election Lab
- Political typology
- Farm BeltAkashic typology
- Population
- 13,8652024 5-year
- Median household income
- $65,1162024 5-year
- White (non-Hispanic)
- 86.3%2024 5-year
- Black
- 6.7%2024 5-year
- Hispanic / Latino
- 2.9%2024 5-year
- Peak Democratic margin
- D+8 in 1992MIT Election Lab
- Peak Republican margin
- R+68 in 1920MIT Election Lab
- Most similar
- Lewis County, WV · similarity 1.00
| Donald Trump ✓Republican | 74.0% | 4,939 |
|---|---|---|
| Kamala HarrisDemocratic | 25.2% | 1,683 |
| OtherAll other candidates | 0.8% | 54 |
| Year | Margin (D minus R) |
|---|---|
| 1876 | No data |
| 1880 | No data |
| 1884 | No data |
| 1888 | No data |
| 1892 | −32.3% |
| 1896 | −40.1% |
| 1900 | −43.6% |
| 1904 | −53.5% |
| 1908 | −50.6% |
| 1912 | −26.6% |
| 1916 | −50.6% |
| 1920 | −67.7% |
| 1924 | −51.1% |
| 1928 | −46.3% |
| 1932 | −4.7% |
| 1936 | −12.2% |
| 1940 | −25.2% |
| 1944 | −36.4% |
| 1948 | −26.5% |
| 1952 | −21.7% |
| 1956 | −28.8% |
| 1960 | −26.2% |
| 1964 | +4.9% |
| 1968 | −25.5% |
| 1972 | −40.3% |
| 1976 | +6.3% |
| 1980 | −20.1% |
| 1984 | −9.0% |
| 1988 | −4.1% |
| 1992 | +8.4% |
| 1996 | +5.5% |
| 2000 | −11.3% |
| 2004 | −23.9% |
| 2008 | −23.4% |
| 2012 | −33.7% |
| 2016 | −49.1% |
| 2020 | −48.0% |
| 2024 | −48.8% |
| Year | Won | Margin | Democratic | Republican | Total |
|---|---|---|---|---|---|
| R | 1,683 | 4,939 | 6,676 | ||
| R | 1,725 | 4,997 | 6,818 | ||
| R | 1,558 | 4,846 | 6,697 | ||
| R | 2,092 | 4,278 | 6,495 | ||
| R | 2,693 | 4,371 | 7,186 | ||
| R | 2,805 | 4,578 | 7,424 | ||
| R | 2,912 | 3,676 | 6,744 | ||
| D | 2,841 | 2,507 | 6,058 | ||
| D | 3,347 | 2,754 | 7,056 | ||
| R | 3,227 | 3,507 | 6,763 | ||
| R | 3,194 | 3,827 | 7,049 | ||
| R | 2,821 | 4,284 | 7,272 | ||
| D | 3,666 | 3,226 | 6,937 | ||
| R | 1,831 | 4,313 | 6,162 | ||
| R | 1,934 | 3,578 | 6,446 | ||
| D | 3,396 | 3,078 | 6,474 | ||
| R | 2,644 | 4,521 | 7,171 | ||
| R | 2,359 | 4,265 | 6,629 | ||
| R | 2,711 | 4,212 | 6,930 | ||
| R | 1,842 | 3,201 | 5,125 | ||
| R | 1,758 | 3,814 | 5,648 | ||
| R | 2,813 | 4,722 | 7,574 | ||
| R | 3,039 | 3,894 | 6,983 | ||
| R | 2,593 | 2,851 | 5,525 | ||
| R | 1,241 | 3,405 | 4,673 | ||
| R | 920 | 3,227 | 4,517 | ||
| R | 688 | 3,731 | 4,496 | ||
| R | 1,236 | 3,926 | 5,317 | ||
| R | 599 | 1,341 | 2,790 | ||
| R | 652 | 2,084 | 2,829 | ||
| R | 589 | 2,078 | 2,781 | ||
| R | 796 | 2,057 | 2,890 | ||
| R | 869 | 2,046 | 2,938 | ||
| R | 799 | 1,652 | 2,642 | ||
| — | — | — | — | ||
| — | — | — | — | ||
| — | — | — | — | ||
| — | — | — | — |
Demographics
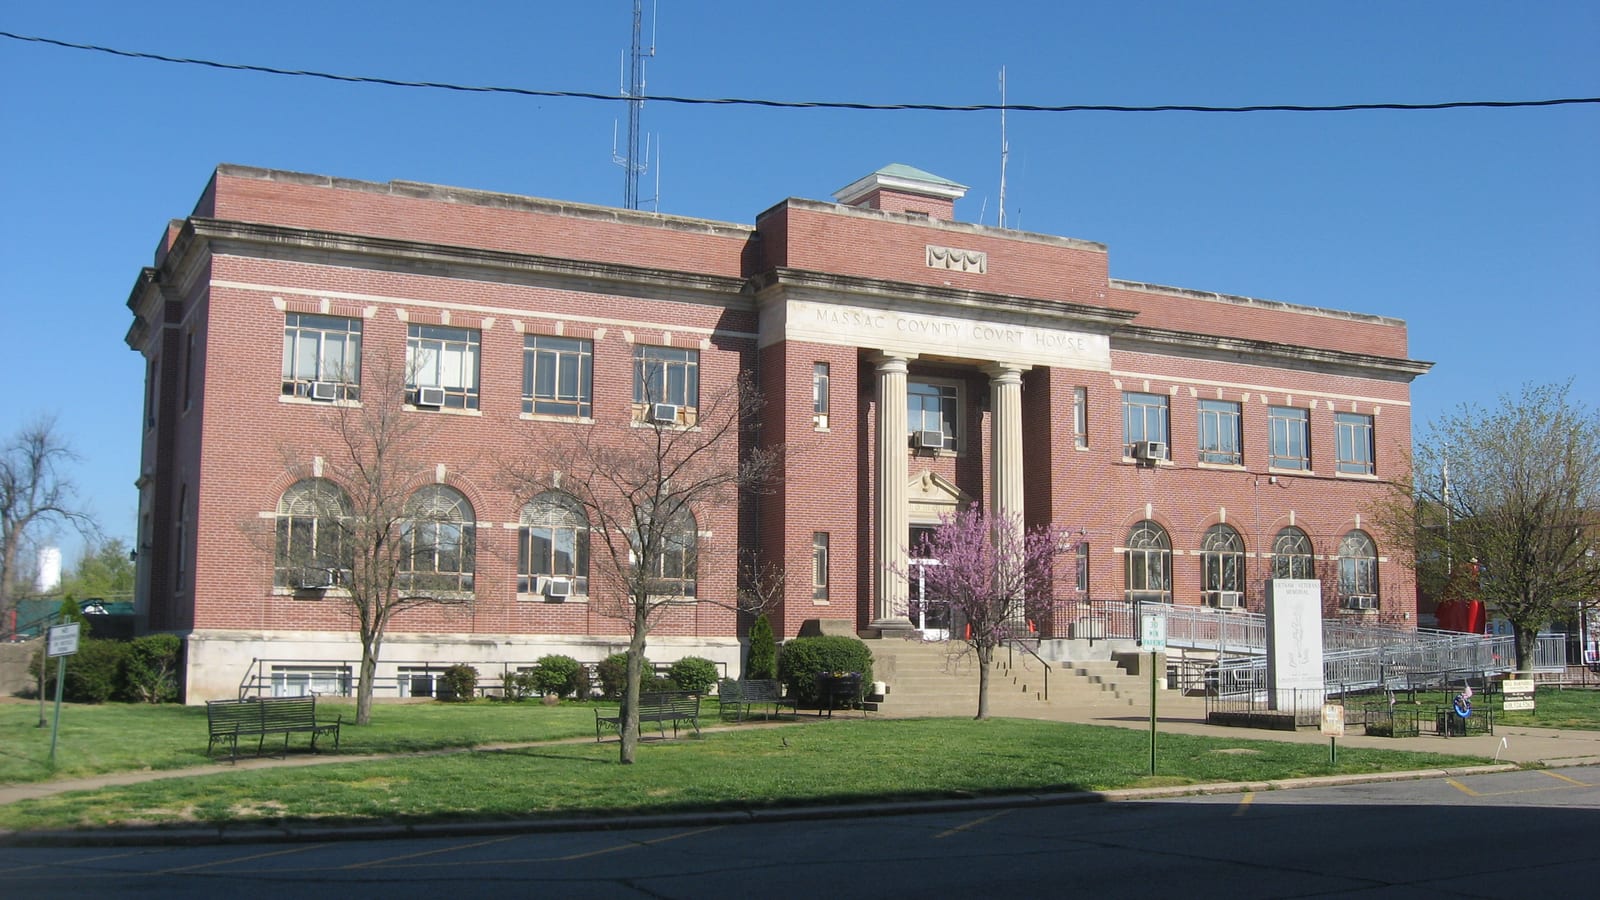
Tucked into Illinois's Ohio River borderland, Massac County votes more like western Kentucky than the Chicago metro, with its 2024 presidential margin exceeding 48 points — among the widest in the state.
The Republican margin here reached sixty-eight points in 1920. Between 2020 and 2024 the county moved one point toward the Republican candidate; the 2024 margin was forty-nine points.
A population of 13,865, a 86% non-Hispanic-white share, and a median household income of $65,116 describe an agricultural county. The county's voting pattern over the last decade is most similar to that of Lewis County and Caldwell County.
Compare two places, side by side
Twelve curated comparisons line up election history, demographics, and the divergence story for two places at a glance. Browse all comparisons →
Massac County, Illinois. Akashic. https://akashic.app/county/17127/. Accessed May 20, 2026. License: CC BY 4.0.