Van Buren County, Michigan: Industrial Catholic Metro county. In 2024, voted R+15%. Republican peak: R+56 in 1924.
Key facts
- 2024 presidential margin
- R+15MIT Election Lab
- Political typology
- Industrial Catholic MetroAkashic typology
- Population
- 75,7952024 5-year
- Median household income
- $68,1142024 5-year
- White (non-Hispanic)
- 80.2%2024 5-year
- Black
- 3.5%2024 5-year
- Hispanic / Latino
- 12.5%2024 5-year
- Peak Democratic margin
- D+16 in 1964MIT Election Lab
- Peak Republican margin
- R+56 in 1924MIT Election Lab
- Most similar
- McDonough County, IL · similarity 0.97
| Donald Trump ✓Republican | 56.7% | 23,407 |
|---|---|---|
| Kamala HarrisDemocratic | 41.6% | 17,175 |
| OtherAll other candidates | 1.6% | 667 |
| Year | Margin (D minus R) |
|---|---|
| 1876 | No data |
| 1880 | No data |
| 1884 | No data |
| 1888 | No data |
| 1892 | −22.9% |
| 1896 | −6.1% |
| 1900 | −19.9% |
| 1904 | −50.1% |
| 1908 | −30.7% |
| 1912 | −1.5% |
| 1916 | −13.9% |
| 1920 | −53.5% |
| 1924 | −55.6% |
| 1928 | −55.5% |
| 1932 | +1.8% |
| 1936 | −14.4% |
| 1940 | −34.4% |
| 1944 | −37.1% |
| 1948 | −38.8% |
| 1952 | −42.5% |
| 1956 | −39.9% |
| 1960 | −29.0% |
| 1964 | +16.5% |
| 1968 | −16.4% |
| 1972 | −31.3% |
| 1976 | −13.4% |
| 1980 | −20.1% |
| 1984 | −29.8% |
| 1988 | −15.2% |
| 1992 | +7.0% |
| 1996 | +7.2% |
| 2000 | −3.4% |
| 2004 | −4.3% |
| 2008 | +8.8% |
| 2012 | +0.5% |
| 2016 | −13.9% |
| 2020 | −12.3% |
| 2024 | −15.1% |
| Year | Won | Margin | Democratic | Republican | Total |
|---|---|---|---|---|---|
| R | 17,175 | 23,407 | 41,249 | ||
| R | 16,803 | 21,591 | 39,066 | ||
| R | 13,258 | 17,890 | 33,274 | ||
| D | 16,290 | 16,141 | 32,837 | ||
| D | 18,588 | 15,534 | 34,766 | ||
| R | 16,151 | 17,634 | 34,174 | ||
| R | 13,796 | 14,792 | 29,482 | ||
| D | 13,355 | 11,347 | 27,975 | ||
| D | 12,466 | 10,357 | 30,237 | ||
| R | 10,668 | 14,522 | 25,400 | ||
| R | 8,853 | 16,426 | 25,445 | ||
| R | 9,248 | 14,451 | 25,824 | ||
| R | 10,366 | 13,615 | 24,302 | ||
| R | 7,159 | 13,903 | 21,531 | ||
| R | 7,304 | 10,676 | 20,607 | ||
| D | 11,336 | 8,120 | 19,504 | ||
| R | 7,082 | 12,903 | 20,096 | ||
| R | 5,678 | 13,291 | 19,063 | ||
| R | 5,309 | 13,231 | 18,659 | ||
| R | 4,082 | 9,511 | 14,004 | ||
| R | 5,002 | 10,951 | 16,037 | ||
| R | 5,625 | 11,571 | 17,297 | ||
| R | 6,720 | 9,110 | 16,655 | ||
| D | 7,223 | 6,954 | 14,641 | ||
| R | 2,643 | 9,325 | 12,050 | ||
| R | 1,646 | 7,384 | 10,320 | ||
| R | 1,988 | 6,904 | 9,192 | ||
| R | 3,225 | 4,302 | 7,776 | ||
| O | 1,994 | 2,101 | 7,242 | ||
| R | 2,313 | 4,531 | 7,215 | ||
| R | 1,634 | 5,254 | 7,230 | ||
| R | 3,235 | 4,892 | 8,331 | ||
| R | 3,982 | 4,510 | 8,682 | ||
| R | 2,182 | 3,788 | 7,008 | ||
| — | — | — | — | ||
| — | — | — | — | ||
| — | — | — | — | ||
| — | — | — | — |
Demographics
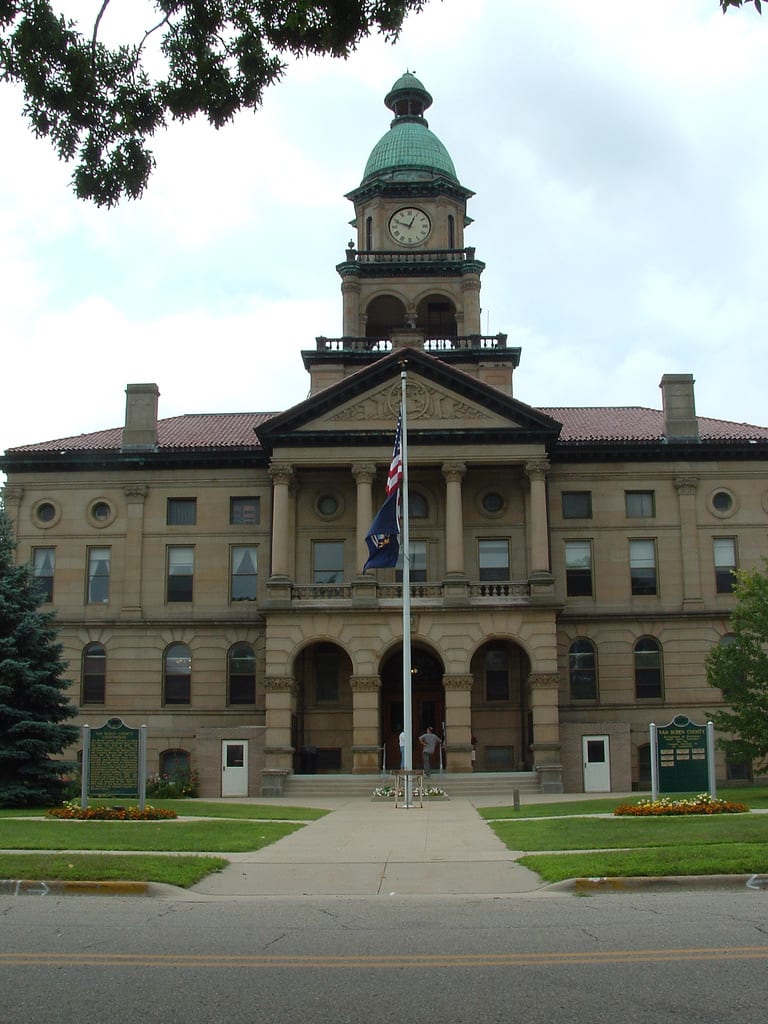
Stretching along Lake Michigan's eastern shore, Van Buren County is Michigan's leading producer of blueberries and grapes, and its rural farming communities have driven a steady rightward shift — the 2024 presidential margin reached R+15.1, up from closer margins a decade ago.
Its margins are typically close. The Democratic margin reached sixteen points in 1964; the Republican margin reached fifty-six points in 1924. Between 2020 and 2024 the county moved three points toward the Republican candidate; the 2024 margin was fifteen points.
Its demographics sit near national norms: a 80% non-Hispanic-white share, a median household income of $68,114, and a 14% poverty rate. The county's voting pattern over the last decade is most similar to that of McDonough County and Jefferson County.
Compare two places, side by side
Twelve curated comparisons line up election history, demographics, and the divergence story for two places at a glance. Browse all comparisons →
Van Buren County, Michigan. Akashic. https://akashic.app/county/26159/. Accessed May 20, 2026. License: CC BY 4.0.