Clark County, Missouri: Appalachian Realigners county. In 2024, voted R+62%. Republican peak: R+62 in 2024.
Key facts
- 2024 presidential margin
- R+62MIT Election Lab
- Political typology
- Appalachian RealignersAkashic typology
- Population
- 6,6752024 5-year
- Median household income
- $51,7812024 5-year
- White (non-Hispanic)
- 94.9%2024 5-year
- Black
- 1.9%2024 5-year
- Hispanic / Latino
- 1.0%2024 5-year
- Peak Democratic margin
- D+22 in 1992MIT Election Lab
- Peak Republican margin
- R+62 in 2024MIT Election Lab
- Most similar
- Harrison County, OH · similarity 1.00
| Donald Trump ✓Republican | 80.4% | 2,679 |
|---|---|---|
| Kamala HarrisDemocratic | 18.8% | 628 |
| OtherAll other candidates | 0.8% | 26 |
| Year | Margin (D minus R) |
|---|---|
| 1876 | No data |
| 1880 | No data |
| 1884 | No data |
| 1888 | No data |
| 1892 | +3.5% |
| 1896 | +3.8% |
| 1900 | +3.1% |
| 1904 | −3.1% |
| 1908 | −0.1% |
| 1912 | +11.2% |
| 1916 | −2.6% |
| 1920 | −16.1% |
| 1924 | −3.0% |
| 1928 | −20.0% |
| 1932 | +15.9% |
| 1936 | +3.3% |
| 1940 | −7.5% |
| 1944 | −11.3% |
| 1948 | +1.9% |
| 1952 | −16.4% |
| 1956 | −8.9% |
| 1960 | −12.9% |
| 1964 | +14.5% |
| 1968 | −15.8% |
| 1972 | −28.1% |
| 1976 | +3.0% |
| 1980 | −15.2% |
| 1984 | −11.9% |
| 1988 | +12.6% |
| 1992 | +21.7% |
| 1996 | +20.2% |
| 2000 | −2.3% |
| 2004 | −2.8% |
| 2008 | −6.1% |
| 2012 | −10.3% |
| 2016 | −52.3% |
| 2020 | −58.8% |
| 2024 | −61.5% |
| Year | Won | Margin | Democratic | Republican | Total |
|---|---|---|---|---|---|
| R | 628 | 2,679 | 3,333 | ||
| R | 678 | 2,672 | 3,394 | ||
| R | 724 | 2,458 | 3,316 | ||
| R | 1,398 | 1,730 | 3,225 | ||
| R | 1,572 | 1,782 | 3,456 | ||
| R | 1,794 | 1,899 | 3,736 | ||
| R | 1,812 | 1,899 | 3,802 | ||
| D | 1,749 | 1,081 | 3,313 | ||
| D | 1,815 | 1,039 | 3,584 | ||
| D | 1,925 | 1,493 | 3,431 | ||
| R | 1,627 | 2,068 | 3,695 | ||
| R | 1,494 | 2,042 | 3,614 | ||
| D | 1,679 | 1,582 | 3,274 | ||
| R | 1,403 | 2,499 | 3,902 | ||
| R | 1,489 | 2,111 | 3,942 | ||
| D | 2,223 | 1,660 | 3,883 | ||
| R | 2,039 | 2,642 | 4,681 | ||
| R | 2,193 | 2,623 | 4,816 | ||
| R | 2,045 | 2,850 | 4,918 | ||
| D | 2,352 | 2,264 | 4,619 | ||
| R | 2,155 | 2,707 | 4,868 | ||
| R | 2,728 | 3,171 | 5,917 | ||
| D | 3,003 | 2,812 | 5,840 | ||
| D | 3,072 | 2,223 | 5,324 | ||
| R | 2,170 | 3,259 | 5,447 | ||
| R | 2,770 | 2,948 | 5,853 | ||
| R | 2,383 | 3,310 | 5,761 | ||
| R | 1,692 | 1,782 | 3,516 | ||
| D | 1,586 | 1,214 | 3,323 | ||
| R | 1,737 | 1,741 | 3,516 | ||
| R | 1,724 | 1,836 | 3,636 | ||
| D | 2,021 | 1,899 | 3,981 | ||
| D | 2,107 | 1,953 | 4,078 | ||
| D | 1,807 | 1,684 | 3,547 | ||
| — | — | — | — | ||
| — | — | — | — | ||
| — | — | — | — | ||
| — | — | — | — |
Demographics
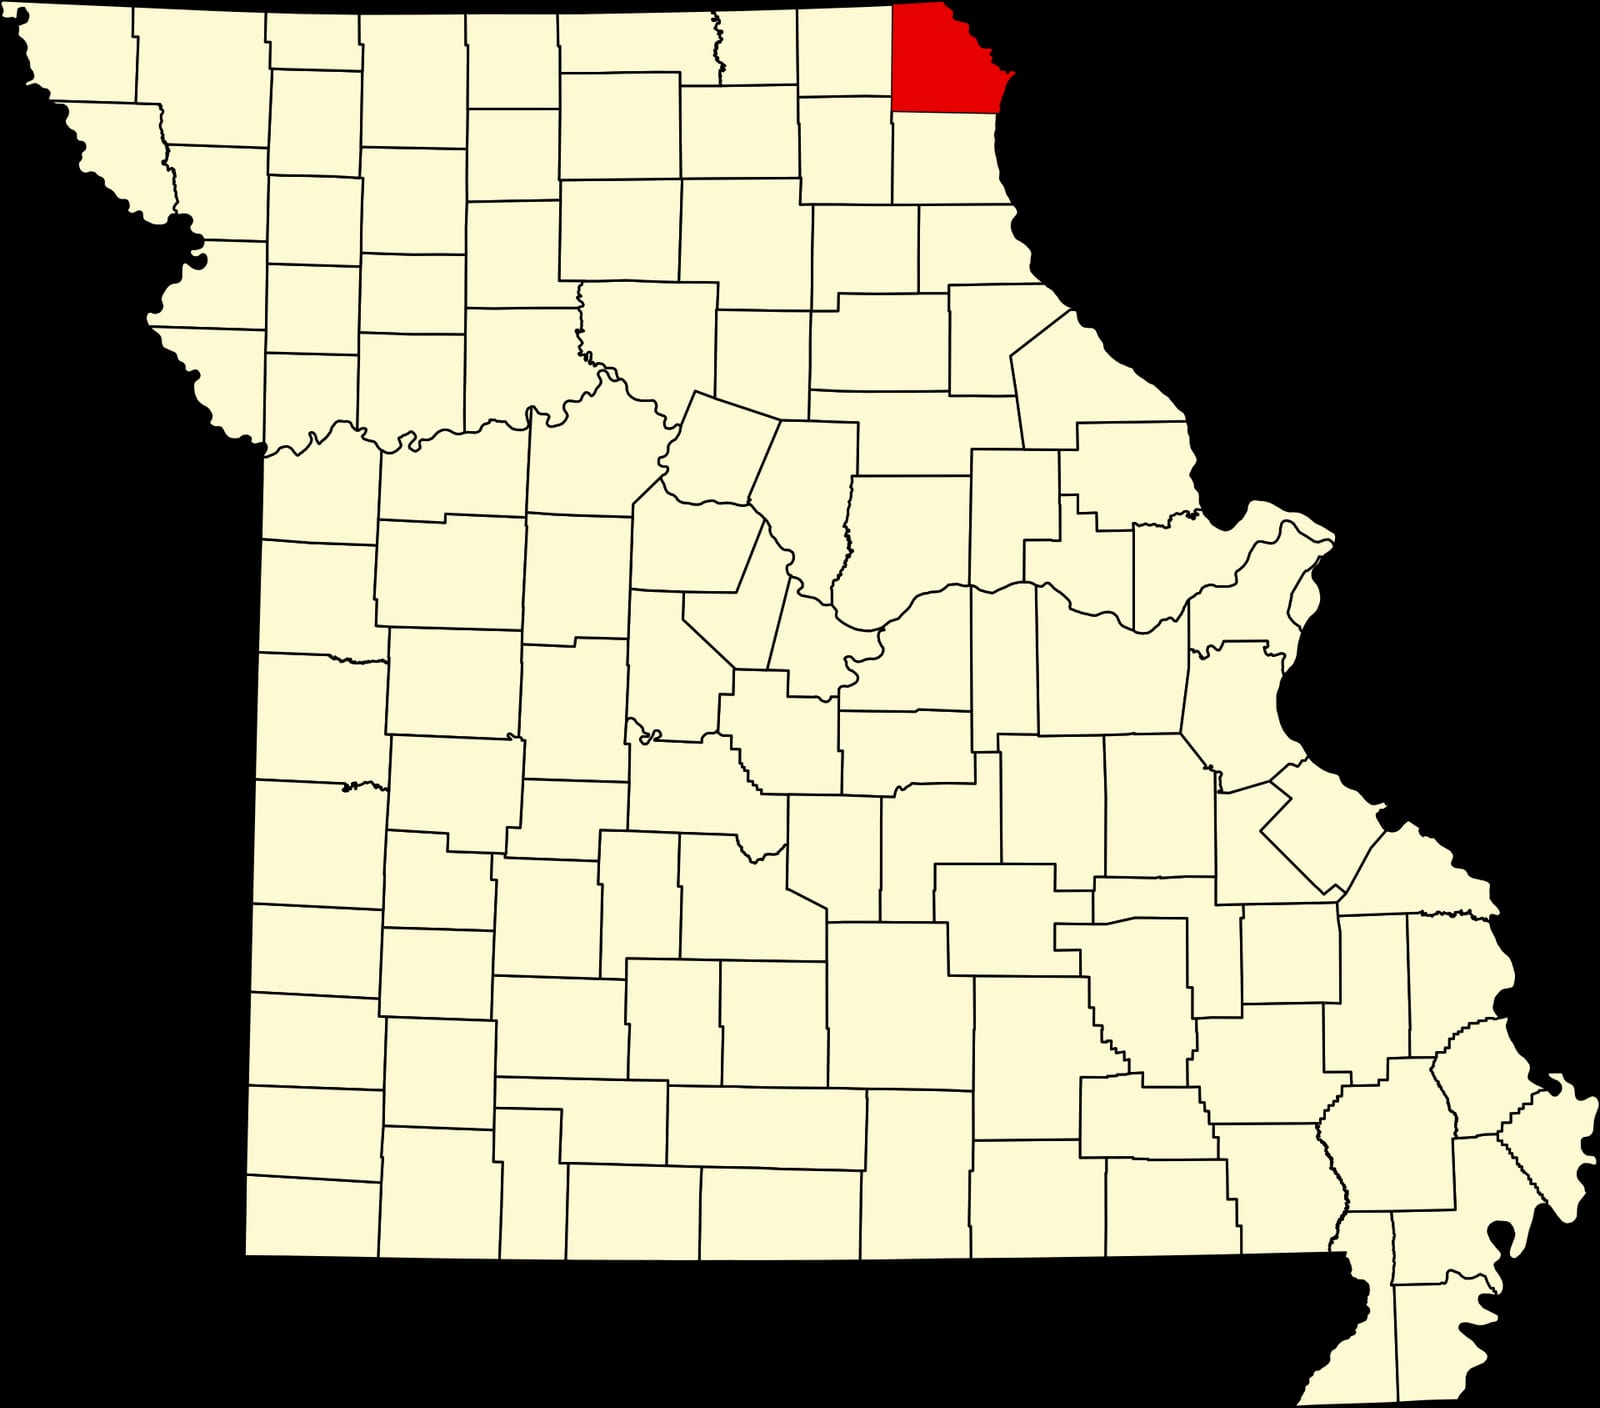
Clark County, tucked into Missouri's northeast corner along the Iowa border, has shifted decisively rightward over two decades; its 2024 presidential margin of R+61.5 reflects a pattern common to sparsely populated agricultural counties across the upper Midwest.
The unraveling was not abrupt. The Democratic margin peaked at twenty-two points in 1992 and narrowed across the late twentieth century. The 2000 election carried the county to the Republican party for the first time in many years, by two points. Between 2020 and 2024 the county moved three points toward the Republican candidate; the 2024 margin was sixty-two points.
The economic context is severe: a median household income of $51,781 — among the lowest at this geographic scale — and a 11% poverty rate. The county's voting pattern over the last decade is most similar to that of Harrison County and Iron County.
Compare two places, side by side
Twelve curated comparisons line up election history, demographics, and the divergence story for two places at a glance. Browse all comparisons →
Clark County, Missouri. Akashic. https://akashic.app/county/29045/. Accessed May 20, 2026. License: CC BY 4.0.