El Paso County, Texas: New American county. In 2024, voted D+15%. Democratic peak: D+73 in 1936.
Key facts
- 2024 presidential margin
- D+15MIT Election Lab
- Political typology
- New AmericanAkashic typology
- Population
- 870,7792024 5-year
- Median household income
- $59,8062024 5-year
- White (non-Hispanic)
- 29.6%2024 5-year
- Black
- 3.4%2024 5-year
- Hispanic / Latino
- 82.7%2024 5-year
- Peak Democratic margin
- D+73 in 1936MIT Election Lab
- Peak Republican margin
- R+21 in 1972MIT Election Lab
- Most similar
- Santa Cruz County, AZ · similarity 0.99
| Kamala Harris ✓Democratic | 56.8% | 143,156 |
|---|---|---|
| Donald TrumpRepublican | 41.7% | 105,124 |
| OtherAll other candidates | 1.5% | 3,725 |
| Year | Margin (D minus R) |
|---|---|
| 1876 | No data |
| 1880 | No data |
| 1884 | No data |
| 1888 | No data |
| 1892 | No data |
| 1896 | No data |
| 1900 | No data |
| 1904 | No data |
| 1908 | No data |
| 1912 | +63.1% |
| 1916 | +33.2% |
| 1920 | +0.9% |
| 1924 | +71.4% |
| 1928 | +0.5% |
| 1932 | +59.0% |
| 1936 | +73.5% |
| 1940 | +53.3% |
| 1944 | +59.5% |
| 1948 | +45.7% |
| 1952 | −15.6% |
| 1956 | −10.0% |
| 1960 | +9.4% |
| 1964 | +25.7% |
| 1968 | +3.4% |
| 1972 | −21.1% |
| 1976 | +3.1% |
| 1980 | −13.3% |
| 1984 | −12.0% |
| 1988 | +5.9% |
| 1992 | +15.2% |
| 1996 | +30.2% |
| 2000 | +18.1% |
| 2004 | +12.9% |
| 2008 | +32.5% |
| 2012 | +32.3% |
| 2016 | +42.8% |
| 2020 | +35.1% |
| 2024 | +15.1% |
| Year | Won | Margin | Democratic | Republican | Total |
|---|---|---|---|---|---|
| D | 143,156 | 105,124 | 252,005 | ||
| D | 178,126 | 84,331 | 267,215 | ||
| D | 147,843 | 55,512 | 215,922 | ||
| D | 112,952 | 57,150 | 172,703 | ||
| D | 122,021 | 61,783 | 185,233 | ||
| D | 95,142 | 73,261 | 169,573 | ||
| D | 83,848 | 57,574 | 145,042 | ||
| D | 83,964 | 43,255 | 134,710 | ||
| D | 67,715 | 47,224 | 135,163 | ||
| D | 62,622 | 55,573 | 118,781 | ||
| R | 51,917 | 66,114 | 118,430 | ||
| R | 40,082 | 53,276 | 99,526 | ||
| D | 45,477 | 42,697 | 89,465 | ||
| R | 32,435 | 49,981 | 83,090 | ||
| D | 32,658 | 30,347 | 68,116 | ||
| D | 35,050 | 20,687 | 55,927 | ||
| D | 26,027 | 21,551 | 47,677 | ||
| R | 15,157 | 18,532 | 33,882 | ||
| R | 14,595 | 20,005 | 34,647 | ||
| D | 15,341 | 5,544 | 21,448 | ||
| D | 11,426 | 2,072 | 15,718 | ||
| D | 12,374 | 3,764 | 16,165 | ||
| D | 11,920 | 1,773 | 13,809 | ||
| D | 11,336 | 2,841 | 14,392 | ||
| D | 6,114 | 6,050 | 12,164 | ||
| D | 7,678 | 1,220 | 9,040 | ||
| D | 4,143 | 4,070 | 8,286 | ||
| D | 3,603 | 1,770 | 5,518 | ||
| D | 2,914 | 291 | 4,159 | ||
| — | — | — | — | ||
| — | — | — | — | ||
| — | — | — | — | ||
| — | — | — | — | ||
| — | — | — | — | ||
| — | — | — | — | ||
| — | — | — | — | ||
| — | — | — | — | ||
| — | — | — | — |
Demographics
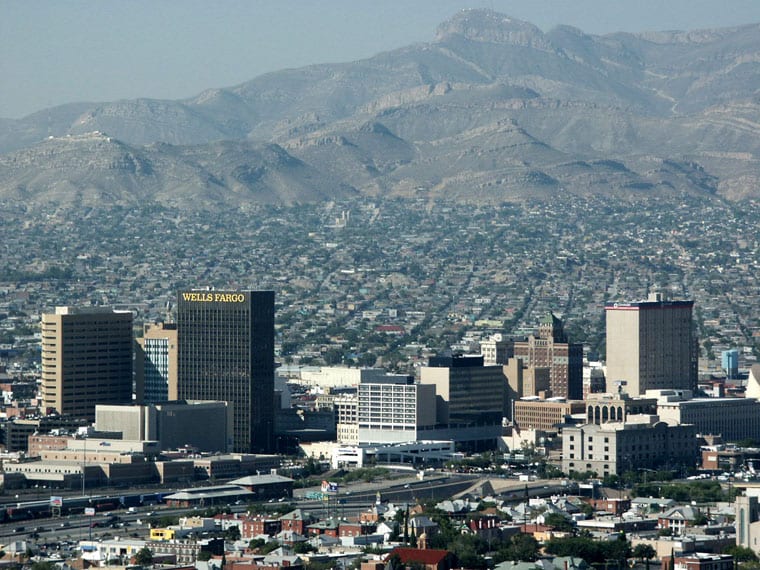
El Paso County sits at the Texas-New Mexico-Chihuahua junction and delivers some of the state's most consistent Democratic margins, driven by a population that is roughly 82% Hispanic — making it a key data point for tracking Latino electoral trends.
El Paso County has leaned Democratic in recent presidential elections, reaching a Democratic margin of seventy-three points in 1936. Between 2020 and 2024 it moved twenty points toward the Republican candidate — part of the sharpest rightward shift recorded among any group of places in the country.
Its demographics describe the shift: a 30% non-Hispanic-white share, a median household income of $59,806, and a population of 870,779. The county's voting pattern over the last decade is most similar to that of Santa Cruz County and Los Angeles County.
Compare two places, side by side
Twelve curated comparisons line up election history, demographics, and the divergence story for two places at a glance. Browse all comparisons →
El Paso County, Texas. Akashic. https://akashic.app/county/48141/. Accessed May 20, 2026. License: CC BY 4.0.