Hardeman County, Texas: Sunbelt Conservative county. In 2024, voted R+73%. Democratic peak: D+86 in 1932.
Key facts
- 2024 presidential margin
- R+73MIT Election Lab
- Political typology
- Sunbelt ConservativeAkashic typology
- Population
- 3,5012024 5-year
- Median household income
- $63,3332024 5-year
- White (non-Hispanic)
- 73.6%2024 5-year
- Black
- 3.4%2024 5-year
- Hispanic / Latino
- 25.6%2024 5-year
- Peak Democratic margin
- D+86 in 1932MIT Election Lab
- Peak Republican margin
- R+73 in 2024MIT Election Lab
- Most similar
- Knox County, TX · similarity 1.00
| Donald Trump ✓Republican | 86.1% | 1,210 |
|---|---|---|
| Kamala HarrisDemocratic | 13.4% | 188 |
| OtherAll other candidates | 0.5% | 7 |
| Year | Margin (D minus R) |
|---|---|
| 1876 | No data |
| 1880 | No data |
| 1884 | No data |
| 1888 | No data |
| 1892 | No data |
| 1896 | No data |
| 1900 | No data |
| 1904 | No data |
| 1908 | No data |
| 1912 | +75.7% |
| 1916 | +72.6% |
| 1920 | +54.0% |
| 1924 | +59.9% |
| 1928 | −18.9% |
| 1932 | +86.2% |
| 1936 | +80.8% |
| 1940 | +74.3% |
| 1944 | +70.5% |
| 1948 | +72.3% |
| 1952 | −11.7% |
| 1956 | +6.7% |
| 1960 | −10.9% |
| 1964 | +44.9% |
| 1968 | +10.7% |
| 1972 | −37.4% |
| 1976 | +26.9% |
| 1980 | +5.2% |
| 1984 | −14.3% |
| 1988 | +14.4% |
| 1992 | +17.6% |
| 1996 | +9.1% |
| 2000 | −26.3% |
| 2004 | −43.1% |
| 2008 | −51.8% |
| 2012 | −58.5% |
| 2016 | −63.3% |
| 2020 | −68.9% |
| 2024 | −72.7% |
| Year | Won | Margin | Democratic | Republican | Total |
|---|---|---|---|---|---|
| R | 188 | 1,210 | 1,405 | ||
| R | 241 | 1,330 | 1,580 | ||
| R | 249 | 1,207 | 1,513 | ||
| R | 302 | 1,176 | 1,495 | ||
| R | 373 | 1,199 | 1,595 | ||
| R | 480 | 1,214 | 1,702 | ||
| R | 566 | 976 | 1,557 | ||
| D | 750 | 610 | 1,531 | ||
| D | 954 | 614 | 1,936 | ||
| D | 1,143 | 855 | 2,001 | ||
| R | 927 | 1,238 | 2,173 | ||
| D | 1,174 | 1,056 | 2,273 | ||
| D | 1,403 | 805 | 2,225 | ||
| R | 614 | 1,357 | 1,987 | ||
| D | 1,145 | 873 | 2,549 | ||
| D | 1,835 | 697 | 2,532 | ||
| R | 1,182 | 1,472 | 2,655 | ||
| D | 1,281 | 1,119 | 2,409 | ||
| R | 1,242 | 1,571 | 2,821 | ||
| D | 1,654 | 226 | 1,976 | ||
| D | 1,756 | 223 | 2,173 | ||
| D | 2,453 | 362 | 2,815 | ||
| D | 1,991 | 207 | 2,208 | ||
| D | 1,985 | 145 | 2,135 | ||
| R | 910 | 1,333 | 2,243 | ||
| D | 1,099 | 256 | 1,408 | ||
| D | 967 | 252 | 1,324 | ||
| D | 932 | 94 | 1,155 | ||
| D | 843 | 36 | 1,066 | ||
| — | — | — | — | ||
| — | — | — | — | ||
| — | — | — | — | ||
| — | — | — | — | ||
| — | — | — | — | ||
| — | — | — | — | ||
| — | — | — | — | ||
| — | — | — | — | ||
| — | — | — | — |
Demographics
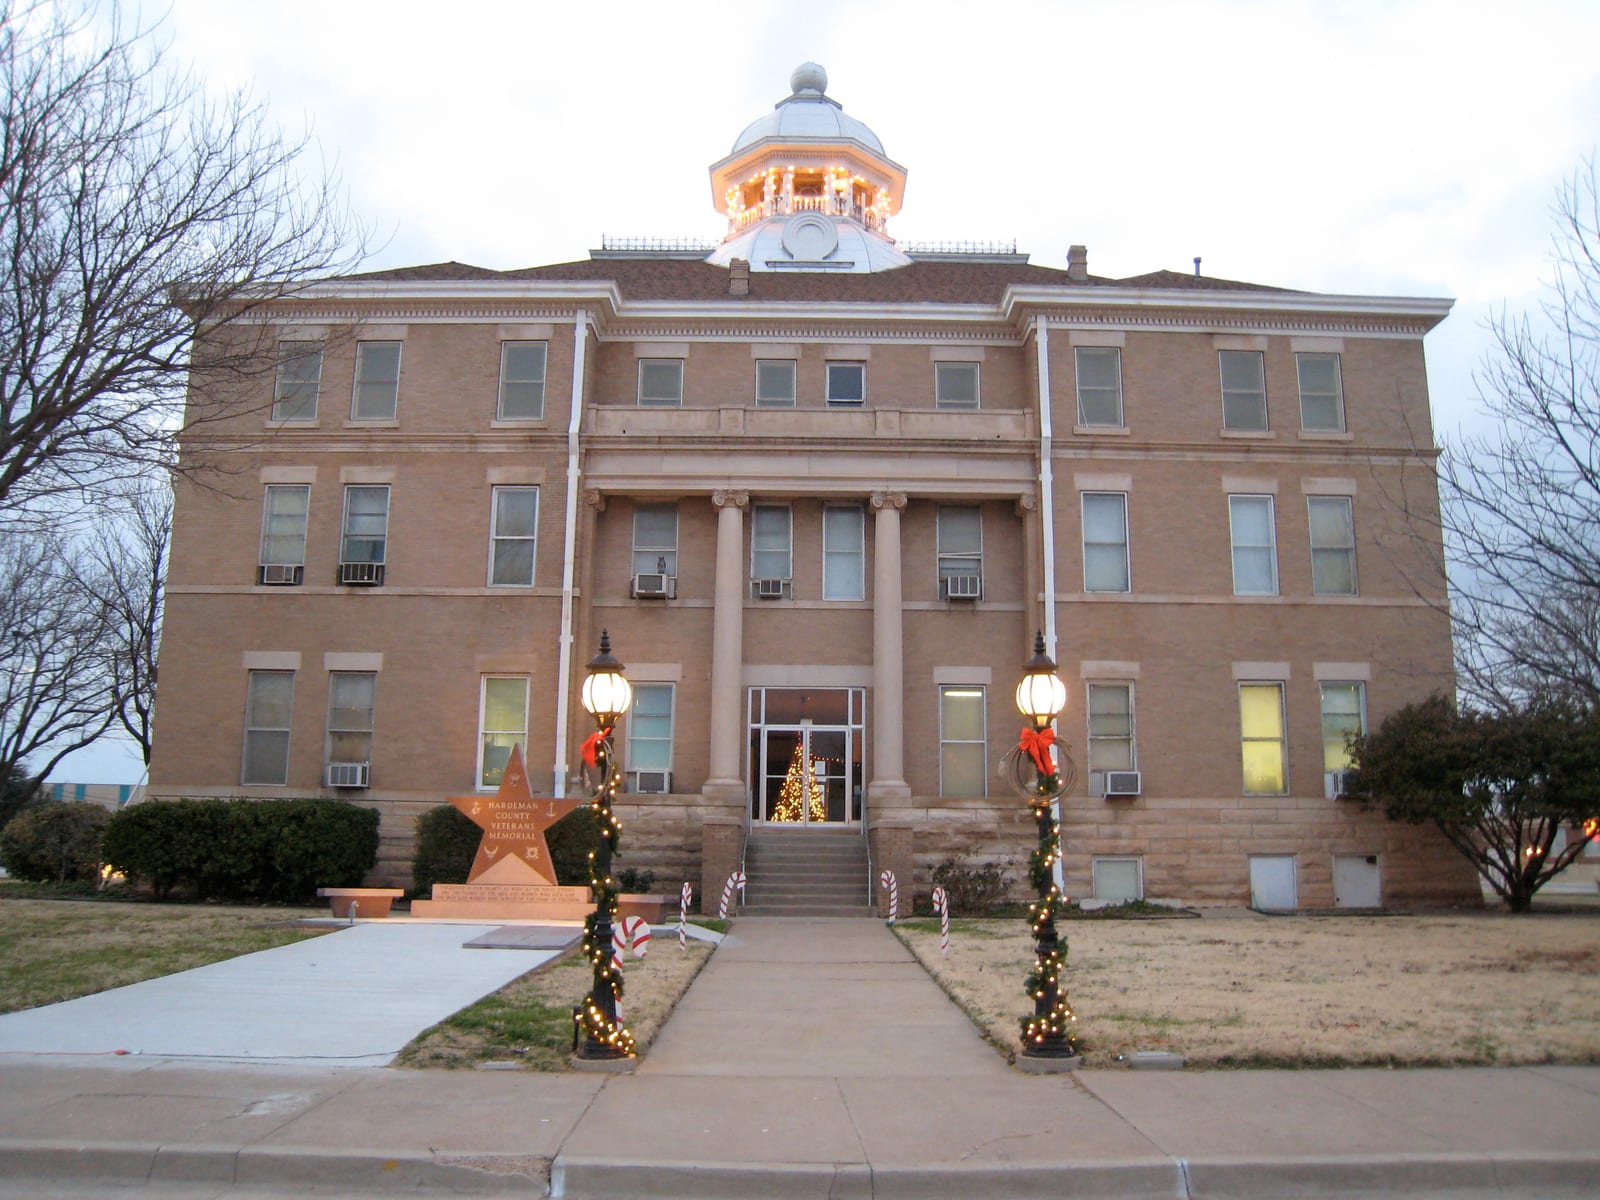
Hardeman County, anchored by the small city of Quanah, delivered over 86% of its 2024 presidential vote to the Republican nominee — a margin consistent with the broader shift toward overwhelming GOP dominance across rural northwest Texas over the past two decades.
The Republican margin here reached seventy-three points in 2024. Between 2020 and 2024 the county moved four points toward the Republican candidate; the 2024 margin was seventy-three points.
A median household income of $63,333, a 74% non-Hispanic-white share, and a population of 3,501 describe the county. The county's voting pattern over the last decade is most similar to that of Knox County and Kent County.
Compare two places, side by side
Twelve curated comparisons line up election history, demographics, and the divergence story for two places at a glance. Browse all comparisons →
Hardeman County, Texas. Akashic. https://akashic.app/county/48197/. Accessed May 20, 2026. License: CC BY 4.0.