Lipscomb County, Texas: New American county. In 2024, voted R+80%. Republican peak: R+80 in 2024.
Key facts
- 2024 presidential margin
- R+80MIT Election Lab
- Political typology
- New AmericanAkashic typology
- Population
- 2,9182024 5-year
- Median household income
- $72,5602024 5-year
- White (non-Hispanic)
- 70.9%2024 5-year
- Black
- 0.0%2024 5-year
- Hispanic / Latino
- 38.6%2024 5-year
- Peak Democratic margin
- D+56 in 1936MIT Election Lab
- Peak Republican margin
- R+80 in 2024MIT Election Lab
- Most similar
- Hutchinson County, TX · similarity 1.00
| Donald Trump ✓Republican | 89.4% | 1,125 |
|---|---|---|
| Kamala HarrisDemocratic | 9.8% | 123 |
| OtherAll other candidates | 0.9% | 11 |
| Year | Margin (D minus R) |
|---|---|
| 1876 | No data |
| 1880 | No data |
| 1884 | No data |
| 1888 | No data |
| 1892 | No data |
| 1896 | No data |
| 1900 | No data |
| 1904 | No data |
| 1908 | No data |
| 1912 | +43.5% |
| 1916 | +44.7% |
| 1920 | −9.1% |
| 1924 | +2.6% |
| 1928 | −39.8% |
| 1932 | +40.6% |
| 1936 | +55.9% |
| 1940 | +26.7% |
| 1944 | +15.0% |
| 1948 | +29.9% |
| 1952 | −70.3% |
| 1956 | −39.9% |
| 1960 | −55.6% |
| 1964 | −12.9% |
| 1968 | −51.8% |
| 1972 | −76.4% |
| 1976 | −17.0% |
| 1980 | −58.0% |
| 1984 | −71.4% |
| 1988 | −49.0% |
| 1992 | −34.5% |
| 1996 | −38.1% |
| 2000 | −66.9% |
| 2004 | −72.0% |
| 2008 | −74.7% |
| 2012 | −79.2% |
| 2016 | −76.9% |
| 2020 | −79.4% |
| 2024 | −79.6% |
| Year | Won | Margin | Democratic | Republican | Total |
|---|---|---|---|---|---|
| R | 123 | 1,125 | 1,259 | ||
| R | 131 | 1,205 | 1,353 | ||
| R | 135 | 1,159 | 1,332 | ||
| R | 119 | 1,044 | 1,168 | ||
| R | 155 | 1,093 | 1,256 | ||
| R | 184 | 1,147 | 1,337 | ||
| R | 206 | 1,072 | 1,294 | ||
| R | 357 | 869 | 1,344 | ||
| R | 338 | 839 | 1,453 | ||
| R | 377 | 1,111 | 1,499 | ||
| R | 241 | 1,461 | 1,708 | ||
| R | 338 | 1,343 | 1,733 | ||
| R | 644 | 911 | 1,569 | ||
| R | 156 | 1,226 | 1,400 | ||
| R | 279 | 1,079 | 1,545 | ||
| R | 589 | 763 | 1,352 | ||
| R | 267 | 939 | 1,209 | ||
| R | 345 | 806 | 1,154 | ||
| R | 204 | 1,174 | 1,379 | ||
| D | 668 | 354 | 1,049 | ||
| D | 551 | 396 | 1,032 | ||
| D | 774 | 445 | 1,231 | ||
| D | 973 | 273 | 1,253 | ||
| D | 865 | 349 | 1,271 | ||
| R | 331 | 776 | 1,119 | ||
| D | 430 | 405 | 949 | ||
| R | 350 | 425 | 821 | ||
| D | 350 | 116 | 523 | ||
| D | 251 | 47 | 469 | ||
| — | — | — | — | ||
| — | — | — | — | ||
| — | — | — | — | ||
| — | — | — | — | ||
| — | — | — | — | ||
| — | — | — | — | ||
| — | — | — | — | ||
| — | — | — | — | ||
| — | — | — | — |
Demographics
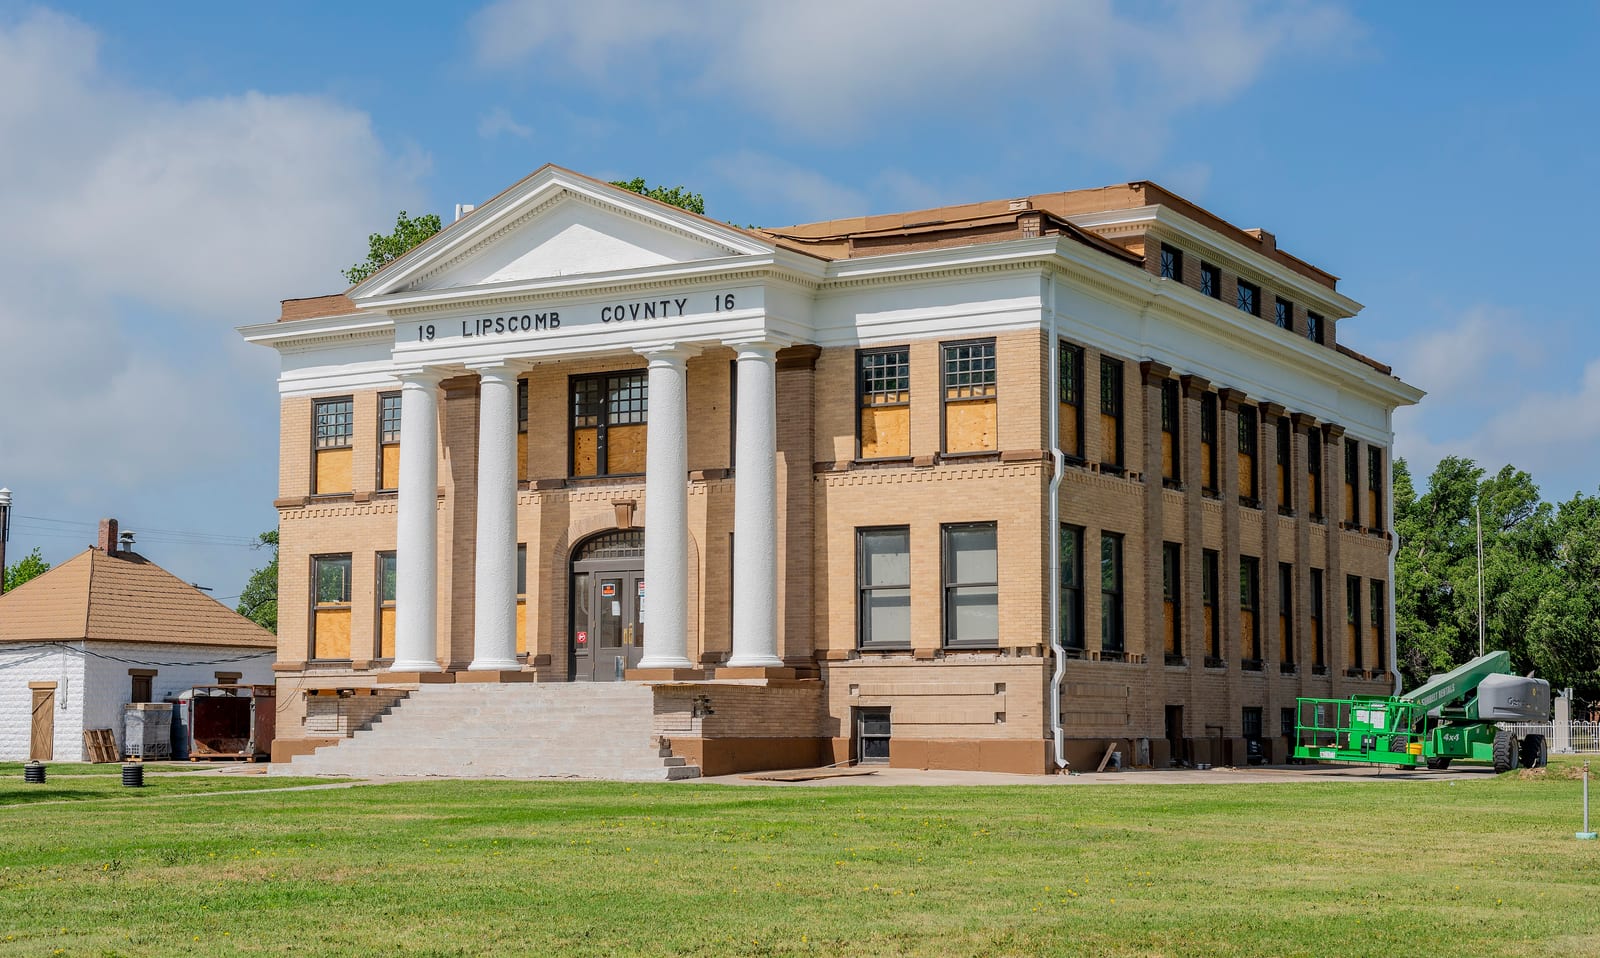
Lipscomb County's sparse, ranching-dominated landscape anchors one of the most Republican-leaning electorates in the state, with fewer than 3,100 residents spread across 932 square miles of the northeastern Panhandle.
Lipscomb County has leaned Republican in recent presidential elections, reaching a Democratic margin of fifty-six points in 1936. The 2024 margin was eighty points.
Its demographics describe the shift: a 71% non-Hispanic-white share, a median household income of $72,560, and a population of 2,918. The county's voting pattern over the last decade is most similar to that of Hutchinson County and Gray County.
Compare two places, side by side
Twelve curated comparisons line up election history, demographics, and the divergence story for two places at a glance. Browse all comparisons →
Lipscomb County, Texas. Akashic. https://akashic.app/county/48295/. Accessed May 20, 2026. License: CC BY 4.0.