Sterling County, Texas: New American county. In 2024, voted R+86%. Democratic peak: D+94 in 1916.
Key facts
- 2024 presidential margin
- R+86MIT Election Lab
- Political typology
- New AmericanAkashic typology
- Population
- 1,4682024 5-year
- Median household income
- $64,9542024 5-year
- White (non-Hispanic)
- 72.5%2024 5-year
- Black
- 0.1%2024 5-year
- Hispanic / Latino
- 35.7%2024 5-year
- Peak Democratic margin
- D+94 in 1916MIT Election Lab
- Peak Republican margin
- R+87 in 2012MIT Election Lab
- Most similar
- Bear Lake County, ID · similarity 1.00
| Donald Trump ✓Republican | 92.7% | 583 |
|---|---|---|
| Kamala HarrisDemocratic | 6.8% | 43 |
| OtherAll other candidates | 0.5% | 3 |
| Year | Margin (D minus R) |
|---|---|
| 1876 | No data |
| 1880 | No data |
| 1884 | No data |
| 1888 | No data |
| 1892 | No data |
| 1896 | No data |
| 1900 | No data |
| 1904 | No data |
| 1908 | No data |
| 1912 | +89.4% |
| 1916 | +93.9% |
| 1920 | +72.6% |
| 1924 | +81.0% |
| 1928 | +15.6% |
| 1932 | +92.9% |
| 1936 | +93.0% |
| 1940 | +92.7% |
| 1944 | +87.2% |
| 1948 | +84.7% |
| 1952 | −27.4% |
| 1956 | −19.6% |
| 1960 | +2.9% |
| 1964 | +26.8% |
| 1968 | −5.1% |
| 1972 | −50.1% |
| 1976 | −7.3% |
| 1980 | −24.9% |
| 1984 | −63.1% |
| 1988 | −42.1% |
| 1992 | −30.8% |
| 1996 | −31.1% |
| 2000 | −58.9% |
| 2004 | −76.9% |
| 2008 | −68.3% |
| 2012 | −86.6% |
| 2016 | −75.7% |
| 2020 | −83.4% |
| 2024 | −85.9% |
| Year | Won | Margin | Democratic | Republican | Total |
|---|---|---|---|---|---|
| R | 43 | 583 | 629 | ||
| R | 51 | 584 | 639 | ||
| R | 70 | 549 | 633 | ||
| R | 31 | 459 | 494 | ||
| R | 97 | 520 | 619 | ||
| R | 71 | 544 | 615 | ||
| R | 132 | 520 | 659 | ||
| R | 186 | 394 | 669 | ||
| R | 127 | 322 | 634 | ||
| R | 188 | 464 | 656 | ||
| R | 129 | 577 | 710 | ||
| R | 218 | 364 | 586 | ||
| R | 174 | 202 | 381 | ||
| R | 94 | 286 | 383 | ||
| R | 151 | 170 | 375 | ||
| D | 243 | 140 | 384 | ||
| D | 193 | 182 | 375 | ||
| R | 150 | 223 | 373 | ||
| R | 158 | 277 | 435 | ||
| D | 244 | 17 | 268 | ||
| D | 330 | 18 | 358 | ||
| D | 425 | 16 | 441 | ||
| D | 384 | 14 | 398 | ||
| D | 354 | 13 | 367 | ||
| D | 167 | 122 | 289 | ||
| D | 243 | 25 | 269 | ||
| D | 152 | 17 | 186 | ||
| D | 205 | 6 | 212 | ||
| D | 165 | 4 | 180 | ||
| — | — | — | — | ||
| — | — | — | — | ||
| — | — | — | — | ||
| — | — | — | — | ||
| — | — | — | — | ||
| — | — | — | — | ||
| — | — | — | — | ||
| — | — | — | — | ||
| — | — | — | — |
Demographics
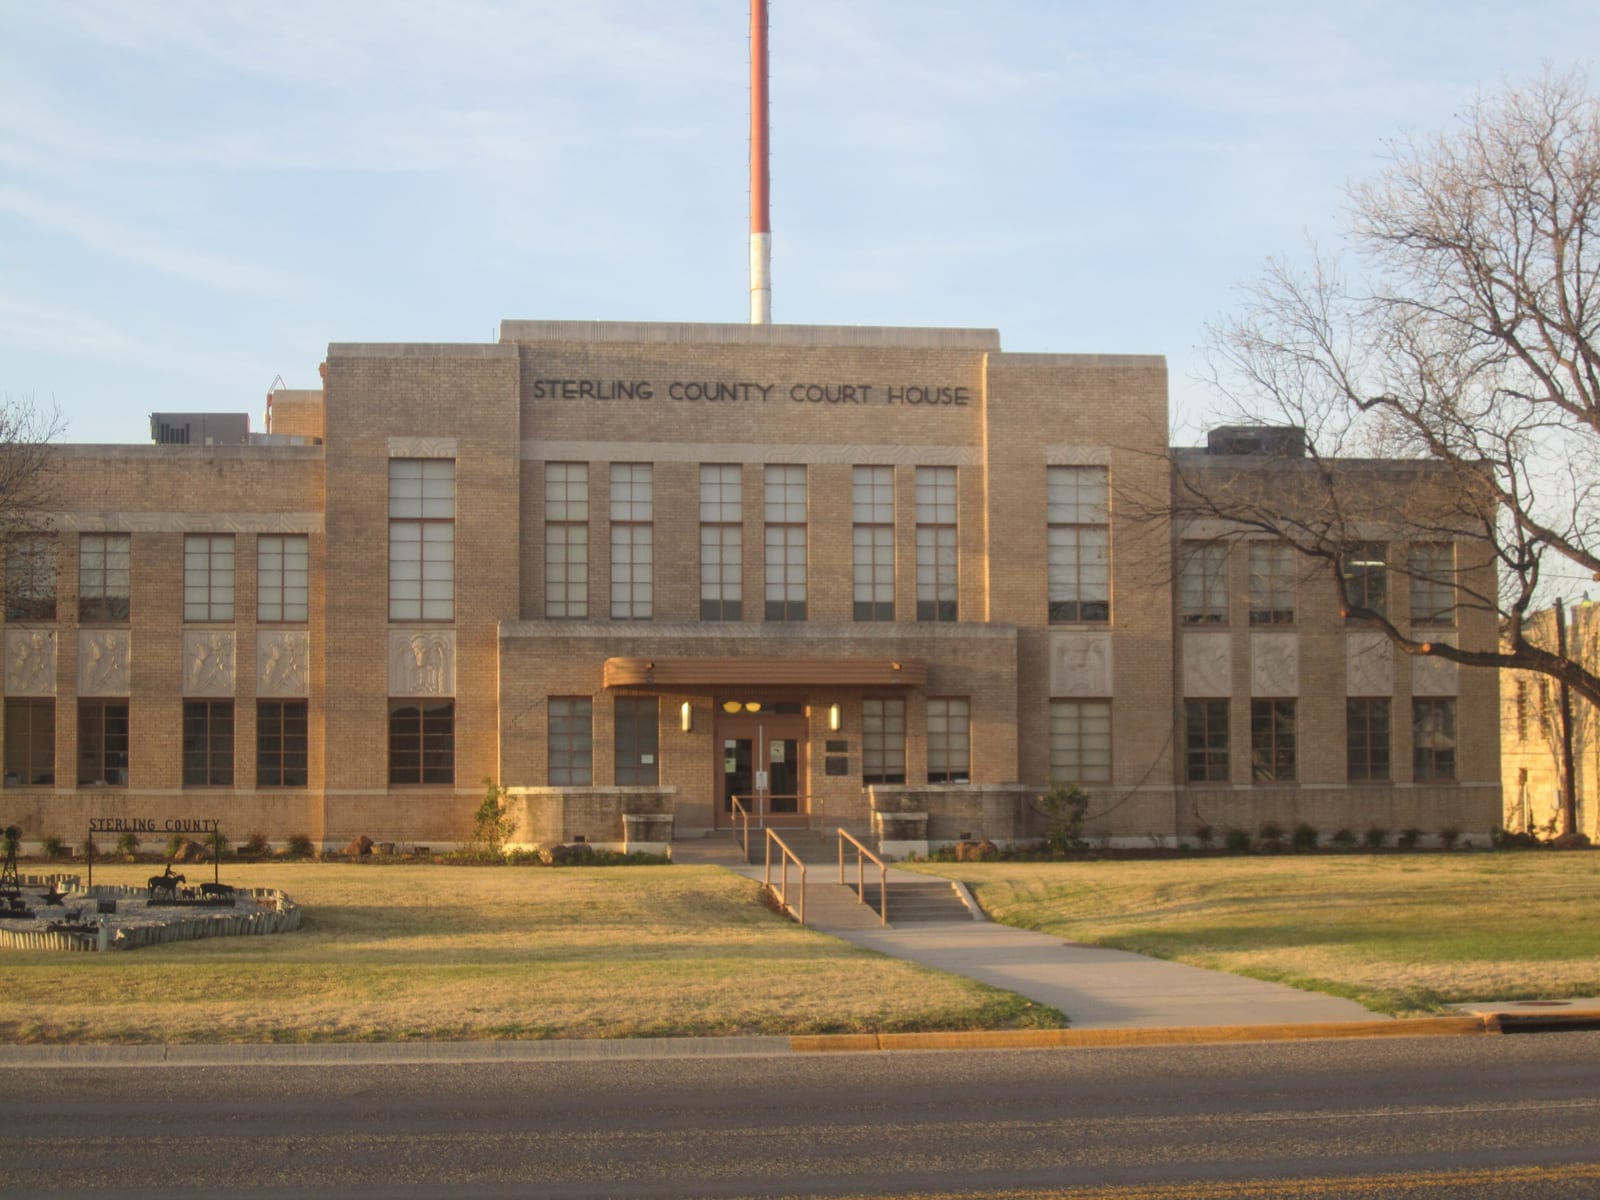
Sterling County's 2024 presidential margin of R+85.8 ranks it among the most one-sided results in the state, a pattern consistent with rural West Texas counties where ranching economies and sparse settlement reinforce durable partisan alignment.
Sterling County has leaned Republican in recent presidential elections, reaching a Democratic margin of ninety-four points in 1916. Between 2020 and 2024 it moved two points toward the Republican candidate — part of the sharpest rightward shift recorded among any group of places in the country.
Its demographics describe the shift: a 73% non-Hispanic-white share, a median household income of $64,954, and a population of 1,468. The county's voting pattern over the last decade is most similar to that of Bear Lake County and Austin County.
Compare two places, side by side
Twelve curated comparisons line up election history, demographics, and the divergence story for two places at a glance. Browse all comparisons →
Sterling County, Texas. Akashic. https://akashic.app/county/48431/. Accessed May 20, 2026. License: CC BY 4.0.