Tarrant County, Texas: New American county. In 2024, voted R+5%. Democratic peak: D+77 in 1936.
Key facts
- 2024 presidential margin
- R+5MIT Election Lab
- Political typology
- New AmericanAkashic typology
- Population
- 2,167,3902024 5-year
- Median household income
- $84,2072024 5-year
- White (non-Hispanic)
- 48.2%2024 5-year
- Black
- 17.7%2024 5-year
- Hispanic / Latino
- 30.3%2024 5-year
- Peak Democratic margin
- D+77 in 1936MIT Election Lab
- Peak Republican margin
- R+38 in 1928MIT Election Lab
- Most similar
- Denton County, TX · similarity 0.98
| Donald Trump ✓Republican | 51.8% | 426,626 |
|---|---|---|
| Kamala HarrisDemocratic | 46.7% | 384,501 |
| OtherAll other candidates | 1.5% | 12,185 |
| Year | Margin (D minus R) |
|---|---|
| 1876 | No data |
| 1880 | No data |
| 1884 | No data |
| 1888 | No data |
| 1892 | No data |
| 1896 | No data |
| 1900 | No data |
| 1904 | No data |
| 1908 | No data |
| 1912 | +74.7% |
| 1916 | +71.4% |
| 1920 | +52.3% |
| 1924 | +35.3% |
| 1928 | −38.0% |
| 1932 | +67.4% |
| 1936 | +77.0% |
| 1940 | +65.6% |
| 1944 | +64.0% |
| 1948 | +31.6% |
| 1952 | −16.1% |
| 1956 | −20.2% |
| 1960 | −10.1% |
| 1964 | +26.3% |
| 1968 | −1.1% |
| 1972 | −37.3% |
| 1976 | −0.9% |
| 1980 | −17.2% |
| 1984 | −34.7% |
| 1988 | −23.1% |
| 1992 | −5.8% |
| 1996 | −9.2% |
| 2000 | −24.0% |
| 2004 | −25.4% |
| 2008 | −11.7% |
| 2012 | −15.7% |
| 2016 | −8.6% |
| 2020 | +0.2% |
| 2024 | −5.1% |
| Year | Won | Margin | Democratic | Republican | Total |
|---|---|---|---|---|---|
| R | 384,501 | 426,626 | 823,312 | ||
| D | 411,567 | 409,741 | 834,697 | ||
| R | 288,392 | 345,921 | 668,514 | ||
| R | 253,071 | 348,920 | 610,890 | ||
| R | 274,880 | 348,420 | 628,553 | ||
| R | 207,286 | 349,462 | 560,141 | ||
| R | 173,758 | 286,921 | 472,389 | ||
| R | 170,431 | 208,312 | 409,644 | ||
| R | 156,230 | 183,387 | 471,396 | ||
| R | 151,310 | 242,660 | 396,237 | ||
| R | 120,147 | 248,050 | 368,862 | ||
| R | 121,068 | 173,466 | 305,066 | ||
| R | 122,287 | 124,433 | 248,631 | ||
| R | 69,187 | 151,596 | 221,138 | ||
| R | 79,705 | 81,786 | 190,747 | ||
| D | 97,092 | 56,593 | 154,158 | ||
| R | 59,385 | 72,813 | 132,986 | ||
| R | 43,922 | 66,329 | 111,197 | ||
| R | 45,968 | 63,680 | 109,842 | ||
| D | 36,325 | 17,157 | 60,739 | ||
| D | 36,791 | 4,113 | 51,065 | ||
| D | 36,062 | 7,474 | 43,589 | ||
| D | 29,791 | 3,781 | 33,762 | ||
| D | 27,836 | 5,251 | 33,513 | ||
| R | 9,208 | 20,481 | 29,689 | ||
| D | 13,673 | 5,859 | 22,151 | ||
| D | 12,431 | 3,486 | 17,108 | ||
| D | 10,269 | 1,550 | 12,213 | ||
| D | 7,222 | 548 | 8,939 | ||
| — | — | — | — | ||
| — | — | — | — | ||
| — | — | — | — | ||
| — | — | — | — | ||
| — | — | — | — | ||
| — | — | — | — | ||
| — | — | — | — | ||
| — | — | — | — | ||
| — | — | — | — |
Demographics
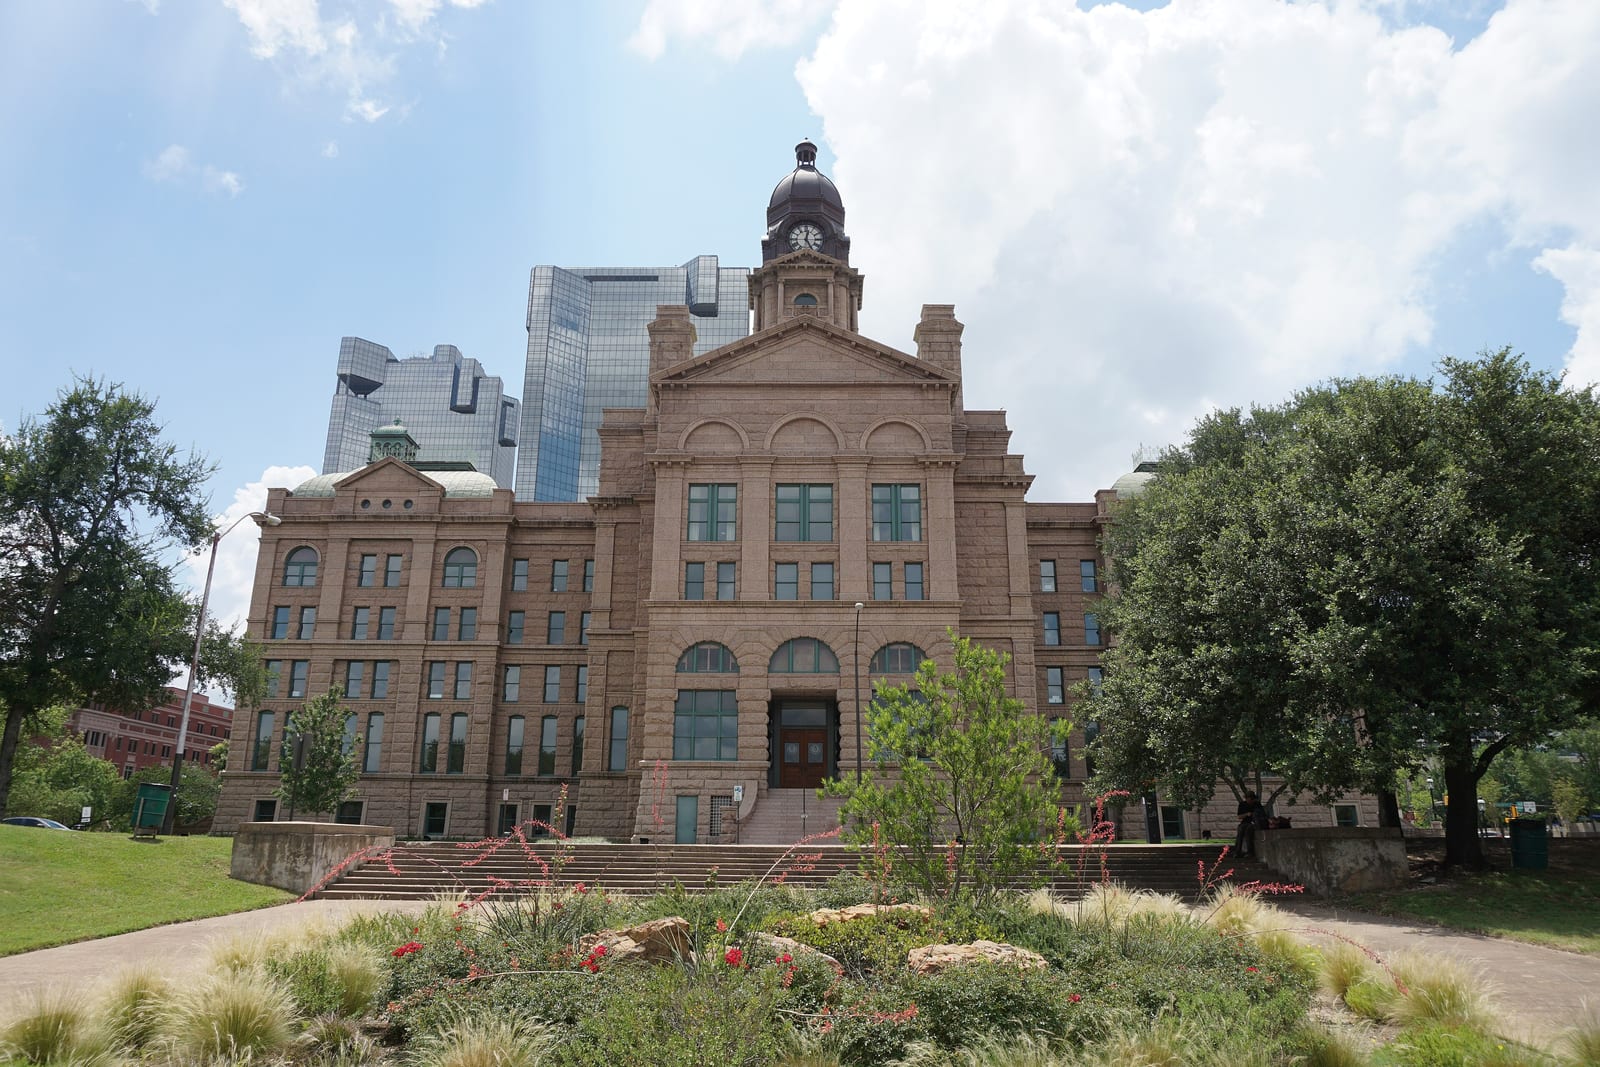
Home to Fort Worth and a fast-growing suburban population, Tarrant County has narrowed its Republican presidential margin from double digits a decade ago to 5.1 points in 2024, reflecting demographic shifts common to large Texas metros.
Tarrant County has leaned Republican in recent presidential elections, reaching a Democratic margin of seventy-seven points in 1936. Between 2020 and 2024 it moved five points toward the Republican candidate — part of the sharpest rightward shift recorded among any group of places in the country.
Its demographics describe the shift: a 48% non-Hispanic-white share, a median household income of $84,207, and a population of 2,167,390. The county's voting pattern over the last decade is most similar to that of Denton County and Placer County.
Compare two places, side by side
Twelve curated comparisons line up election history, demographics, and the divergence story for two places at a glance. Browse all comparisons →
Tarrant County, Texas. Akashic. https://akashic.app/county/48439/. Accessed May 20, 2026. License: CC BY 4.0.