Winkler County, Texas: New American county. In 2024, voted R+71%. Democratic peak: D+100 in 1912.
Key facts
- 2024 presidential margin
- R+71MIT Election Lab
- Political typology
- New AmericanAkashic typology
- Population
- 7,4542024 5-year
- Median household income
- $86,9002024 5-year
- White (non-Hispanic)
- 50.6%2024 5-year
- Black
- 3.9%2024 5-year
- Hispanic / Latino
- 62.5%2024 5-year
- Peak Democratic margin
- D+100 in 1912MIT Election Lab
- Peak Republican margin
- R+71 in 2024MIT Election Lab
- Most similar
- Graham County, AZ · similarity 1.00
| Donald Trump ✓Republican | 85.2% | 1,646 |
|---|---|---|
| Kamala HarrisDemocratic | 14.6% | 283 |
| OtherAll other candidates | 0.2% | 4 |
| Year | Margin (D minus R) |
|---|---|
| 1876 | No data |
| 1880 | No data |
| 1884 | No data |
| 1888 | No data |
| 1892 | No data |
| 1896 | No data |
| 1900 | No data |
| 1904 | No data |
| 1908 | No data |
| 1912 | +100.0% |
| 1916 | +100.0% |
| 1920 | +78.9% |
| 1924 | +87.5% |
| 1928 | +31.4% |
| 1932 | +77.5% |
| 1936 | +86.2% |
| 1940 | +77.2% |
| 1944 | +74.1% |
| 1948 | +65.2% |
| 1952 | −1.4% |
| 1956 | −6.6% |
| 1960 | +2.5% |
| 1964 | +12.0% |
| 1968 | −12.7% |
| 1972 | −60.3% |
| 1976 | −14.1% |
| 1980 | −35.2% |
| 1984 | −49.1% |
| 1988 | −27.2% |
| 1992 | −8.5% |
| 1996 | −6.5% |
| 2000 | −44.6% |
| 2004 | −60.6% |
| 2008 | −51.8% |
| 2012 | −52.9% |
| 2016 | −52.4% |
| 2020 | −65.6% |
| 2024 | −70.5% |
| Year | Won | Margin | Democratic | Republican | Total |
|---|---|---|---|---|---|
| R | 283 | 1,646 | 1,933 | ||
| R | 358 | 1,753 | 2,126 | ||
| R | 420 | 1,403 | 1,876 | ||
| R | 398 | 1,311 | 1,725 | ||
| R | 477 | 1,529 | 2,032 | ||
| R | 391 | 1,604 | 2,002 | ||
| R | 556 | 1,468 | 2,043 | ||
| R | 872 | 1,009 | 2,103 | ||
| R | 942 | 1,173 | 2,702 | ||
| R | 947 | 1,656 | 2,611 | ||
| R | 752 | 2,213 | 2,974 | ||
| R | 1,021 | 2,160 | 3,232 | ||
| R | 1,382 | 1,842 | 3,266 | ||
| R | 602 | 2,467 | 3,095 | ||
| R | 938 | 1,391 | 3,579 | ||
| D | 2,059 | 1,617 | 3,679 | ||
| D | 1,642 | 1,562 | 3,253 | ||
| R | 1,287 | 1,471 | 2,777 | ||
| R | 1,508 | 1,550 | 3,064 | ||
| D | 1,588 | 296 | 1,983 | ||
| D | 1,004 | 120 | 1,193 | ||
| D | 1,340 | 172 | 1,512 | ||
| D | 903 | 63 | 975 | ||
| D | 642 | 78 | 728 | ||
| D | 310 | 162 | 472 | ||
| D | 15 | 1 | 16 | ||
| D | 17 | 2 | 19 | ||
| D | 21 | 0 | 21 | ||
| D | 26 | 0 | 26 | ||
| — | — | — | — | ||
| — | — | — | — | ||
| — | — | — | — | ||
| — | — | — | — | ||
| — | — | — | — | ||
| — | — | — | — | ||
| — | — | — | — | ||
| — | — | — | — | ||
| — | — | — | — |
Demographics
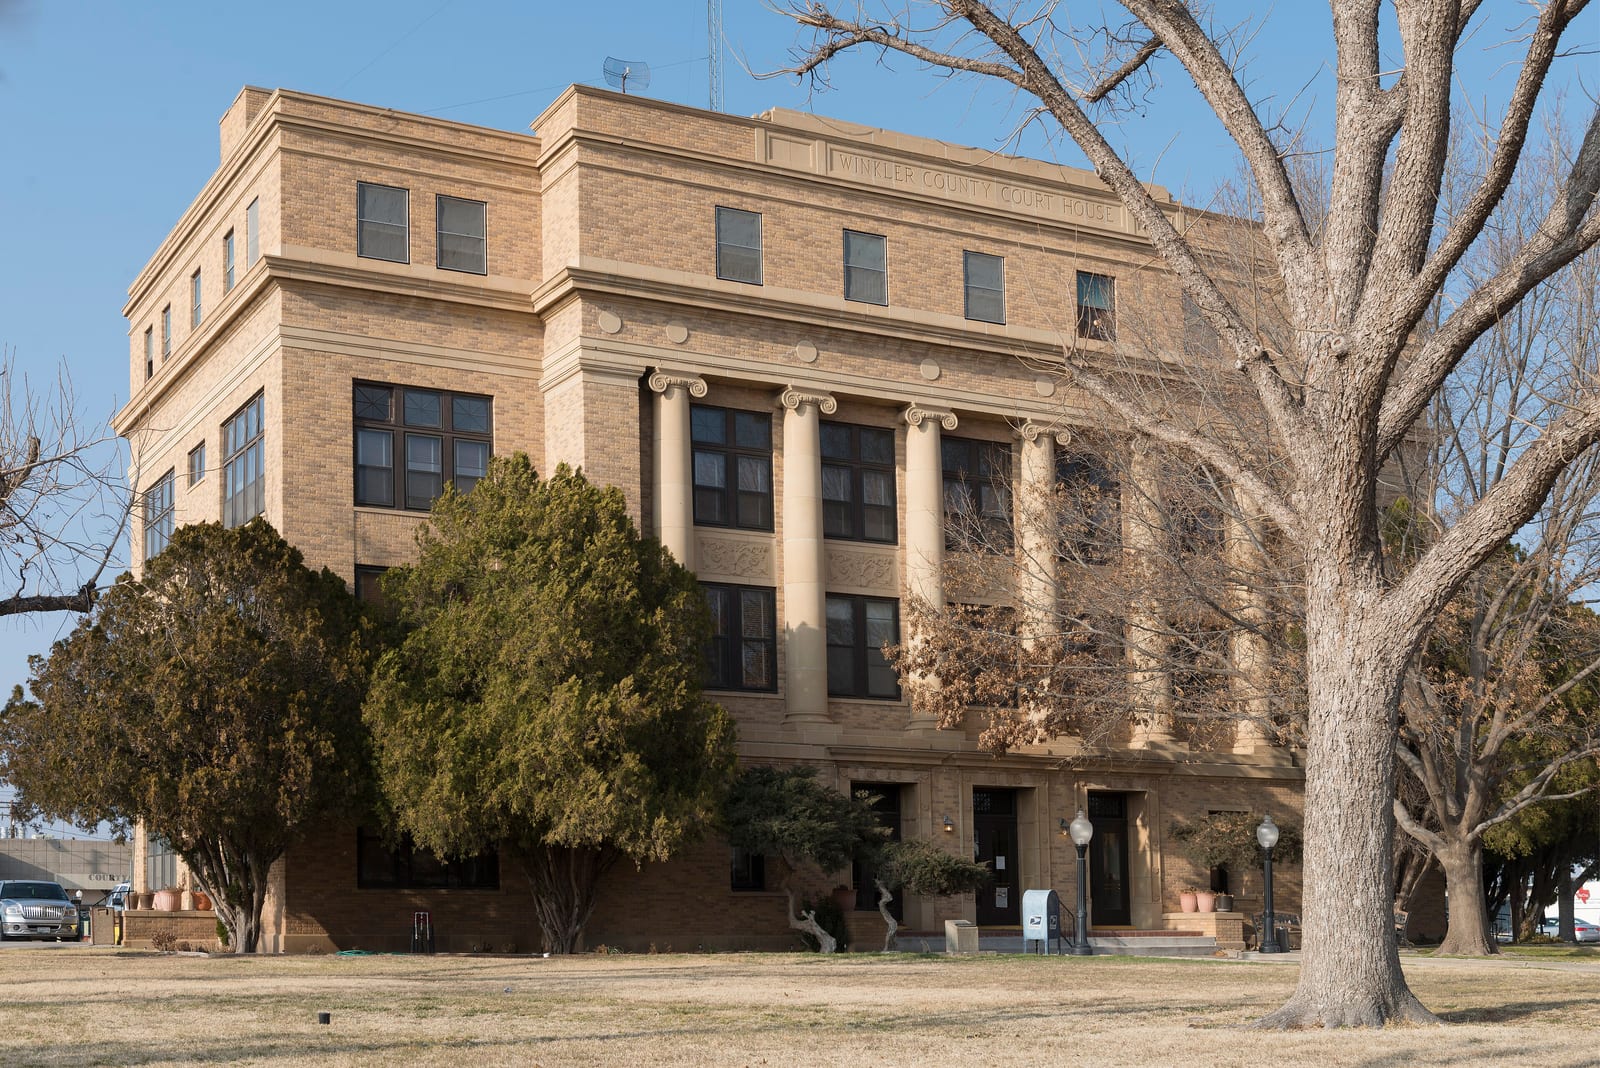
Winkler County sits atop the Permian Basin's western edge, where the extractive economy and sparse, majority-Hispanic rural population have nonetheless produced some of Texas's most lopsided Republican presidential margins over the past decade.
Winkler County has leaned Republican in recent presidential elections, reaching a Democratic margin of 100 points in 1912. Between 2020 and 2024 it moved five points toward the Republican candidate — part of the sharpest rightward shift recorded among any group of places in the country.
Its demographics describe the shift: a 51% non-Hispanic-white share, a median household income of $86,900, and a population of 7,454. The county's voting pattern over the last decade is most similar to that of Graham County and Sutton County.
Compare two places, side by side
Twelve curated comparisons line up election history, demographics, and the divergence story for two places at a glance. Browse all comparisons →
Winkler County, Texas. Akashic. https://akashic.app/county/48495/. Accessed May 20, 2026. License: CC BY 4.0.