Zavala County, Texas: New American county. In 2024, voted D+14%. Democratic peak: D+69 in 2008.
Key facts
- 2024 presidential margin
- D+14MIT Election Lab
- Political typology
- New AmericanAkashic typology
- Population
- 9,4122024 5-year
- Median household income
- $36,7492024 5-year
- White (non-Hispanic)
- 22.1%2024 5-year
- Black
- 0.8%2024 5-year
- Hispanic / Latino
- 92.6%2024 5-year
- Peak Democratic margin
- D+69 in 2008MIT Election Lab
- Peak Republican margin
- R+43 in 1928MIT Election Lab
- Most similar
- Dimmit County, TX · similarity 1.00
| Kamala Harris ✓Democratic | 56.8% | 1,984 |
|---|---|---|
| Donald TrumpRepublican | 42.4% | 1,482 |
| OtherAll other candidates | 0.7% | 26 |
| Year | Margin (D minus R) |
|---|---|
| 1876 | No data |
| 1880 | No data |
| 1884 | No data |
| 1888 | No data |
| 1892 | No data |
| 1896 | No data |
| 1900 | No data |
| 1904 | No data |
| 1908 | No data |
| 1912 | +47.9% |
| 1916 | +63.9% |
| 1920 | +41.3% |
| 1924 | +51.0% |
| 1928 | −42.8% |
| 1932 | +64.7% |
| 1936 | +57.8% |
| 1940 | +48.1% |
| 1944 | +31.4% |
| 1948 | +31.6% |
| 1952 | −21.2% |
| 1956 | −25.8% |
| 1960 | −3.7% |
| 1964 | +49.7% |
| 1968 | +27.7% |
| 1972 | −6.8% |
| 1976 | +42.2% |
| 1980 | +50.6% |
| 1984 | +52.0% |
| 1988 | +68.2% |
| 1992 | +64.3% |
| 1996 | +67.8% |
| 2000 | +55.0% |
| 2004 | +49.9% |
| 2008 | +68.8% |
| 2012 | +67.6% |
| 2016 | +57.2% |
| 2020 | +31.4% |
| 2024 | +14.4% |
| Year | Won | Margin | Democratic | Republican | Total |
|---|---|---|---|---|---|
| D | 1,984 | 1,482 | 3,492 | ||
| D | 2,864 | 1,490 | 4,382 | ||
| D | 2,636 | 694 | 3,396 | ||
| D | 3,042 | 574 | 3,653 | ||
| D | 3,263 | 596 | 3,876 | ||
| D | 2,332 | 777 | 3,118 | ||
| D | 2,616 | 751 | 3,391 | ||
| D | 2,629 | 463 | 3,193 | ||
| D | 3,058 | 571 | 3,868 | ||
| D | 3,338 | 628 | 3,973 | ||
| D | 2,937 | 924 | 3,868 | ||
| D | 2,621 | 831 | 3,538 | ||
| D | 1,822 | 735 | 2,578 | ||
| R | 1,122 | 1,288 | 2,432 | ||
| D | 1,307 | 693 | 2,215 | ||
| D | 1,784 | 598 | 2,385 | ||
| R | 706 | 761 | 1,475 | ||
| R | 528 | 896 | 1,427 | ||
| R | 677 | 1,043 | 1,723 | ||
| D | 618 | 306 | 986 | ||
| D | 696 | 342 | 1,129 | ||
| D | 739 | 259 | 998 | ||
| D | 788 | 209 | 1,002 | ||
| D | 783 | 166 | 953 | ||
| R | 229 | 571 | 800 | ||
| D | 326 | 95 | 453 | ||
| D | 264 | 101 | 395 | ||
| D | 229 | 43 | 291 | ||
| D | 242 | 44 | 413 | ||
| — | — | — | — | ||
| — | — | — | — | ||
| — | — | — | — | ||
| — | — | — | — | ||
| — | — | — | — | ||
| — | — | — | — | ||
| — | — | — | — | ||
| — | — | — | — | ||
| — | — | — | — |
Demographics
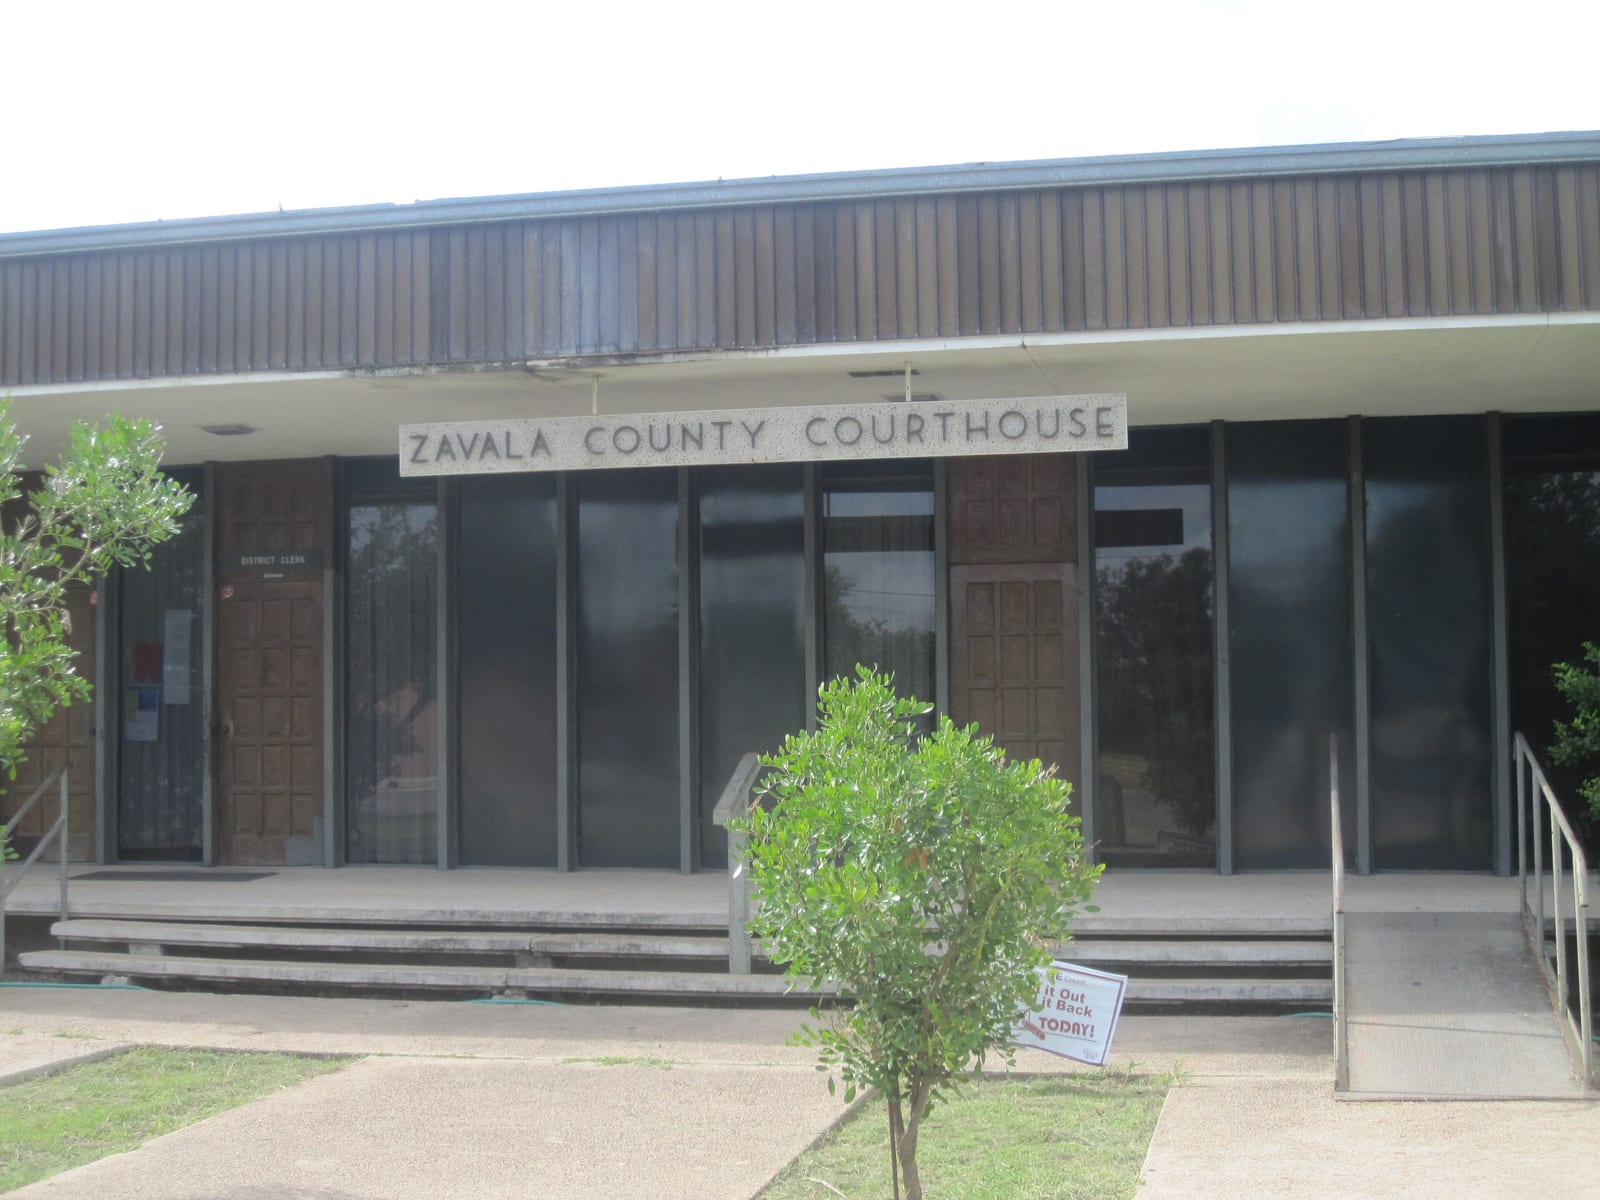
Zavala County, anchored by Crystal City, runs heavily Democratic in statewide contests, though its D+14.4 margin in 2024 reflects a notable rightward shift from the double-digit Democratic leads that once exceeded 40 points in this predominantly Hispanic, rural border region.
Zavala County has leaned Democratic in recent presidential elections, reaching a Democratic margin of sixty-nine points in 2008. Between 2020 and 2024 it moved seventeen points toward the Republican candidate — part of the sharpest rightward shift recorded among any group of places in the country.
Its demographics describe the shift: a 22% non-Hispanic-white share, a median household income of $36,749, and a population of 9,412. The county's voting pattern over the last decade is most similar to that of Dimmit County and Charles City County.
Compare two places, side by side
Twelve curated comparisons line up election history, demographics, and the divergence story for two places at a glance. Browse all comparisons →
Zavala County, Texas. Akashic. https://akashic.app/county/48507/. Accessed May 20, 2026. License: CC BY 4.0.