Jefferson County, Alabama: Industrial Catholic Metro county. In 2024, voted D+10%. Democratic peak: D+80 in 1936.
Key facts
- 2024 presidential margin
- D+10MIT Election Lab
- Political typology
- Industrial Catholic MetroAkashic typology
- Population
- 667,7552024 5-year
- Median household income
- $66,3882024 5-year
- White (non-Hispanic)
- 48.4%2024 5-year
- Black
- 42.2%2024 5-year
- Hispanic / Latino
- 5.5%2024 5-year
- Peak Democratic margin
- D+80 in 1936MIT Election Lab
- Peak Republican margin
- R+73 in 1964MIT Election Lab
- Most similar
- Manassas city, VA · similarity 0.98
| Kamala Harris ✓Democratic | 54.3% | 162,112 |
|---|---|---|
| Donald TrumpRepublican | 43.9% | 131,123 |
| OtherAll other candidates | 1.8% | 5,469 |
| Year | Margin (D minus R) |
|---|---|
| 1876 | +50.6% |
| 1880 | +34.9% |
| 1884 | +3.9% |
| 1888 | +29.1% |
| 1892 | +63.8% |
| 1896 | +41.6% |
| 1900 | +22.5% |
| 1904 | +66.5% |
| 1908 | +52.5% |
| 1912 | +67.0% |
| 1916 | +65.7% |
| 1920 | +54.2% |
| 1924 | +39.8% |
| 1928 | −3.8% |
| 1932 | +72.5% |
| 1936 | +80.0% |
| 1940 | +69.1% |
| 1944 | +61.2% |
| 1948 | −19.2% |
| 1952 | +8.3% |
| 1956 | −5.8% |
| 1960 | −14.8% |
| 1964 | −72.6% |
| 1968 | +7.8% |
| 1972 | −39.2% |
| 1976 | −6.5% |
| 1980 | −7.5% |
| 1984 | −19.1% |
| 1988 | −15.9% |
| 1992 | −8.0% |
| 1996 | −4.1% |
| 2000 | −3.1% |
| 2004 | −9.0% |
| 2008 | +5.1% |
| 2012 | +6.0% |
| 2016 | +7.4% |
| 2020 | +13.1% |
| 2024 | +10.4% |
| Year | Won | Margin | Democratic | Republican | Total |
|---|---|---|---|---|---|
| D | 162,112 | 131,123 | 298,704 | ||
| D | 181,688 | 138,843 | 325,848 | ||
| D | 156,873 | 134,768 | 298,286 | ||
| D | 159,876 | 141,683 | 303,918 | ||
| D | 166,121 | 149,921 | 318,524 | ||
| R | 132,286 | 158,680 | 292,967 | ||
| R | 129,889 | 138,491 | 273,763 | ||
| R | 120,208 | 130,980 | 260,906 | ||
| R | 125,889 | 149,832 | 298,884 | ||
| R | 107,766 | 148,879 | 257,833 | ||
| R | 107,506 | 158,362 | 266,547 | ||
| R | 113,069 | 132,612 | 259,512 | ||
| R | 99,531 | 113,590 | 217,090 | ||
| R | 57,288 | 135,095 | 198,528 | ||
| O | 55,845 | 39,752 | 205,033 | ||
| R | 0 | 100,756 | 138,838 | ||
| R | 44,369 | 60,004 | 105,898 | ||
| R | 38,604 | 43,695 | 87,513 | ||
| D | 38,111 | 32,254 | 70,766 | ||
| O | 0 | 7,261 | 37,861 | ||
| D | 31,101 | 7,409 | 38,684 | ||
| D | 37,110 | 6,714 | 44,001 | ||
| D | 35,980 | 3,810 | 40,194 | ||
| D | 30,858 | 4,567 | 36,239 | ||
| R | 16,735 | 18,060 | 34,907 | ||
| D | 15,133 | 5,678 | 23,780 | ||
| D | 24,982 | 7,124 | 32,939 | ||
| D | 10,677 | 2,052 | 13,120 | ||
| D | 8,887 | 693 | 12,226 | ||
| D | 7,803 | 2,182 | 10,707 | ||
| D | 6,424 | 1,090 | 8,022 | ||
| D | 4,580 | 2,842 | 7,721 | ||
| D | 8,819 | 3,394 | 13,032 | ||
| D | 10,055 | 296 | 15,304 | ||
| D | 5,508 | 3,001 | 8,613 | ||
| D | 2,183 | 2,018 | 4,264 | ||
| D | 1,712 | 781 | 2,669 | ||
| D | 2,102 | 689 | 2,791 |
Demographics
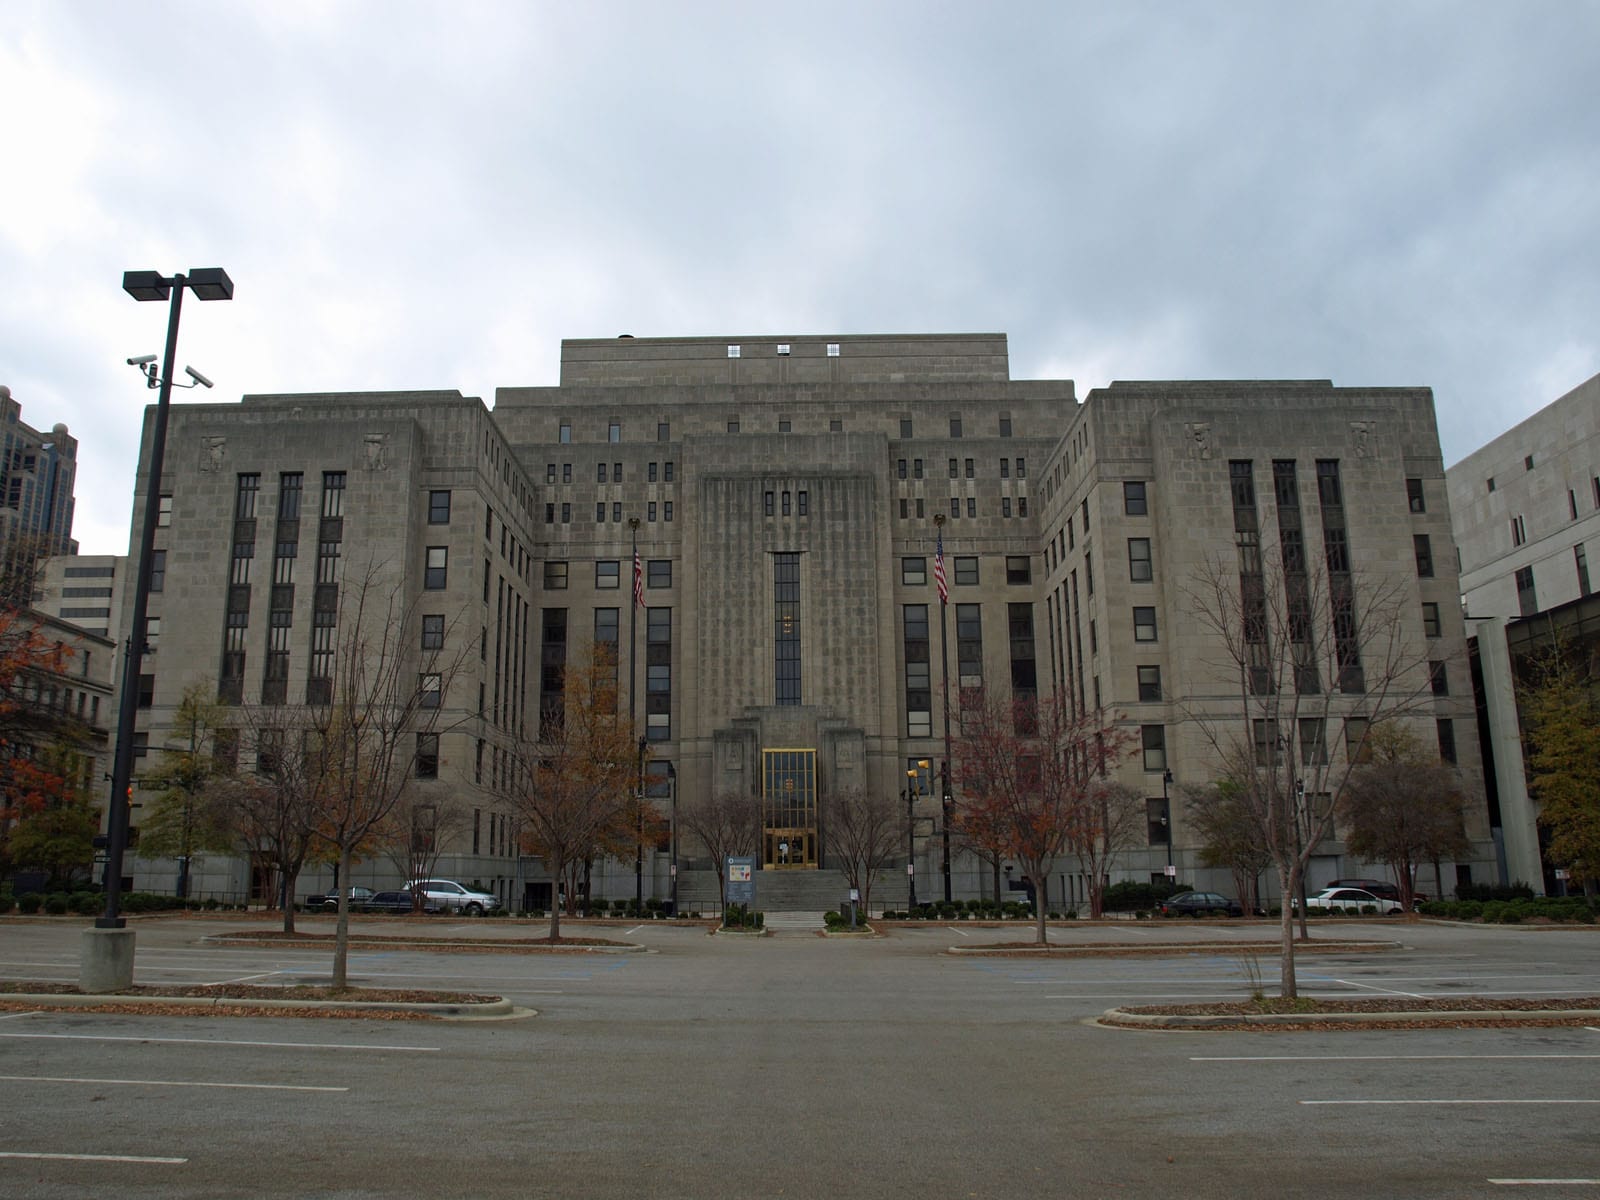
Home to Birmingham and a majority-Black electorate, Jefferson County delivered a 10-point Democratic margin in 2024 — a striking outlier in a state that went Republican statewide by nearly 30 points.
Its margins are typically close. The Democratic margin reached eighty points in 1936; the Republican margin reached seventy-three points in 1964. Between 2020 and 2024 the county moved three points toward the Republican candidate; the 2024 margin was ten points.
Its demographics sit near national norms: a 48% non-Hispanic-white share, a median household income of $66,388, and a 16% poverty rate. The county's voting pattern over the last decade is most similar to that of Manassas city and Henrico County.
Compare two places, side by side
Twelve curated comparisons line up election history, demographics, and the divergence story for two places at a glance. Browse all comparisons →
Jefferson County, Alabama. Akashic. https://akashic.app/county/01073/. Accessed May 20, 2026. License: CC BY 4.0.