Cleburne County, Arkansas: Evangelical Deep South county. In 2024, voted R+68%. Democratic peak: D+81 in 1896.
Key facts
- 2024 presidential margin
- R+68MIT Election Lab
- Political typology
- Evangelical Deep SouthAkashic typology
- Population
- 25,2262024 5-year
- Median household income
- $55,7982024 5-year
- White (non-Hispanic)
- 93.8%2024 5-year
- Black
- 0.3%2024 5-year
- Hispanic / Latino
- 3.0%2024 5-year
- Peak Democratic margin
- D+81 in 1896MIT Election Lab
- Peak Republican margin
- R+68 in 2024MIT Election Lab
- Most similar
- Hart County, GA · similarity 1.00
| Donald Trump ✓Republican | 83.2% | 10,595 |
|---|---|---|
| Kamala HarrisDemocratic | 15.2% | 1,941 |
| OtherAll other candidates | 1.6% | 203 |
| Year | Margin (D minus R) |
|---|---|
| 1876 | No data |
| 1880 | No data |
| 1884 | No data |
| 1888 | No data |
| 1892 | +43.1% |
| 1896 | +80.5% |
| 1900 | +38.5% |
| 1904 | +26.2% |
| 1908 | +22.8% |
| 1912 | +42.1% |
| 1916 | +52.3% |
| 1920 | +18.2% |
| 1924 | +36.8% |
| 1928 | +19.6% |
| 1932 | +78.0% |
| 1936 | +46.5% |
| 1940 | +37.8% |
| 1944 | +17.9% |
| 1948 | +51.8% |
| 1952 | +6.4% |
| 1956 | +7.2% |
| 1960 | +5.2% |
| 1964 | +36.7% |
| 1968 | −2.4% |
| 1972 | −34.4% |
| 1976 | +48.3% |
| 1980 | −0.3% |
| 1984 | −28.8% |
| 1988 | −18.2% |
| 1992 | +15.1% |
| 1996 | +7.1% |
| 2000 | −15.8% |
| 2004 | −22.0% |
| 2008 | −44.2% |
| 2012 | −52.1% |
| 2016 | −62.4% |
| 2020 | −65.8% |
| 2024 | −67.9% |
| Year | Won | Margin | Democratic | Republican | Total |
|---|---|---|---|---|---|
| R | 1,941 | 10,595 | 12,739 | ||
| R | 1,988 | 10,328 | 12,680 | ||
| R | 2,101 | 9,458 | 11,788 | ||
| R | 2,620 | 8,693 | 11,647 | ||
| R | 2,951 | 7,962 | 11,338 | ||
| R | 4,517 | 7,107 | 11,761 | ||
| R | 4,120 | 5,730 | 10,207 | ||
| D | 4,475 | 3,807 | 9,464 | ||
| D | 5,090 | 3,580 | 9,980 | ||
| R | 3,404 | 4,932 | 8,381 | ||
| R | 3,172 | 5,769 | 9,008 | ||
| R | 4,021 | 4,042 | 8,355 | ||
| D | 5,726 | 1,992 | 7,731 | ||
| R | 1,400 | 2,870 | 4,274 | ||
| O | 1,202 | 1,301 | 4,160 | ||
| D | 2,645 | 1,221 | 3,875 | ||
| D | 1,144 | 1,026 | 2,282 | ||
| D | 1,094 | 947 | 2,048 | ||
| D | 1,045 | 918 | 1,971 | ||
| D | 1,061 | 312 | 1,447 | ||
| D | 839 | 582 | 1,437 | ||
| D | 834 | 374 | 1,218 | ||
| D | 927 | 336 | 1,271 | ||
| D | 1,750 | 204 | 1,982 | ||
| D | 856 | 574 | 1,442 | ||
| D | 569 | 238 | 900 | ||
| D | 678 | 459 | 1,206 | ||
| D | 865 | 271 | 1,136 | ||
| D | 517 | 138 | 900 | ||
| D | 506 | 294 | 929 | ||
| D | 394 | 214 | 687 | ||
| D | 520 | 205 | 819 | ||
| D | 1,047 | 108 | 1,166 | ||
| D | 606 | 132 | 1,101 | ||
| — | — | — | — | ||
| — | — | — | — | ||
| — | — | — | — | ||
| — | — | — | — |
Demographics
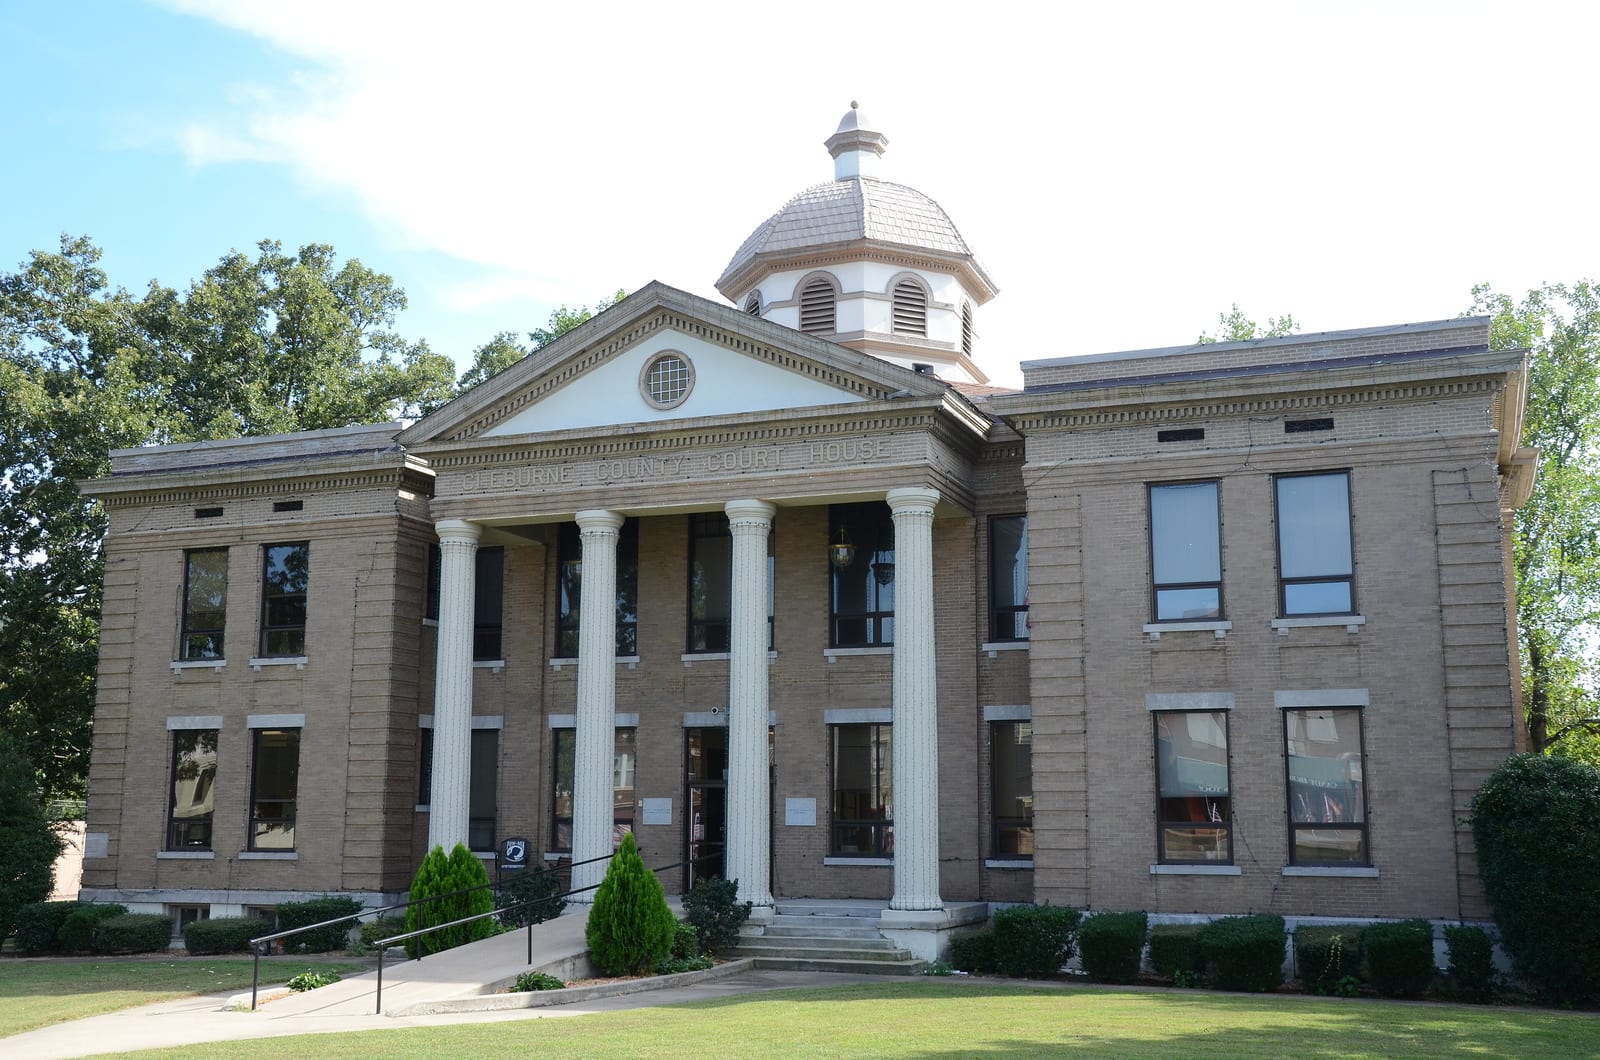
Cleburne County, anchored by Heber Springs on Greers Ferry Lake, recorded an R+67.9 presidential margin in 2024—among the widest in a state where rural, majority-white small counties have shifted sharply over the past two decades.
The Republican margin here reached its widest at sixty-eight points in 2024. Between 2020 and 2024 the county moved two points toward the Republican candidate; the 2024 margin was sixty-eight points.
A median household income of $55,798, a 14% poverty rate, and a 94% non-Hispanic-white share describe the county. The county's voting pattern over the last decade is most similar to that of Hart County and Miller County.
Compare two places, side by side
Twelve curated comparisons line up election history, demographics, and the divergence story for two places at a glance. Browse all comparisons →
Cleburne County, Arkansas. Akashic. https://akashic.app/county/05023/. Accessed May 20, 2026. License: CC BY 4.0.