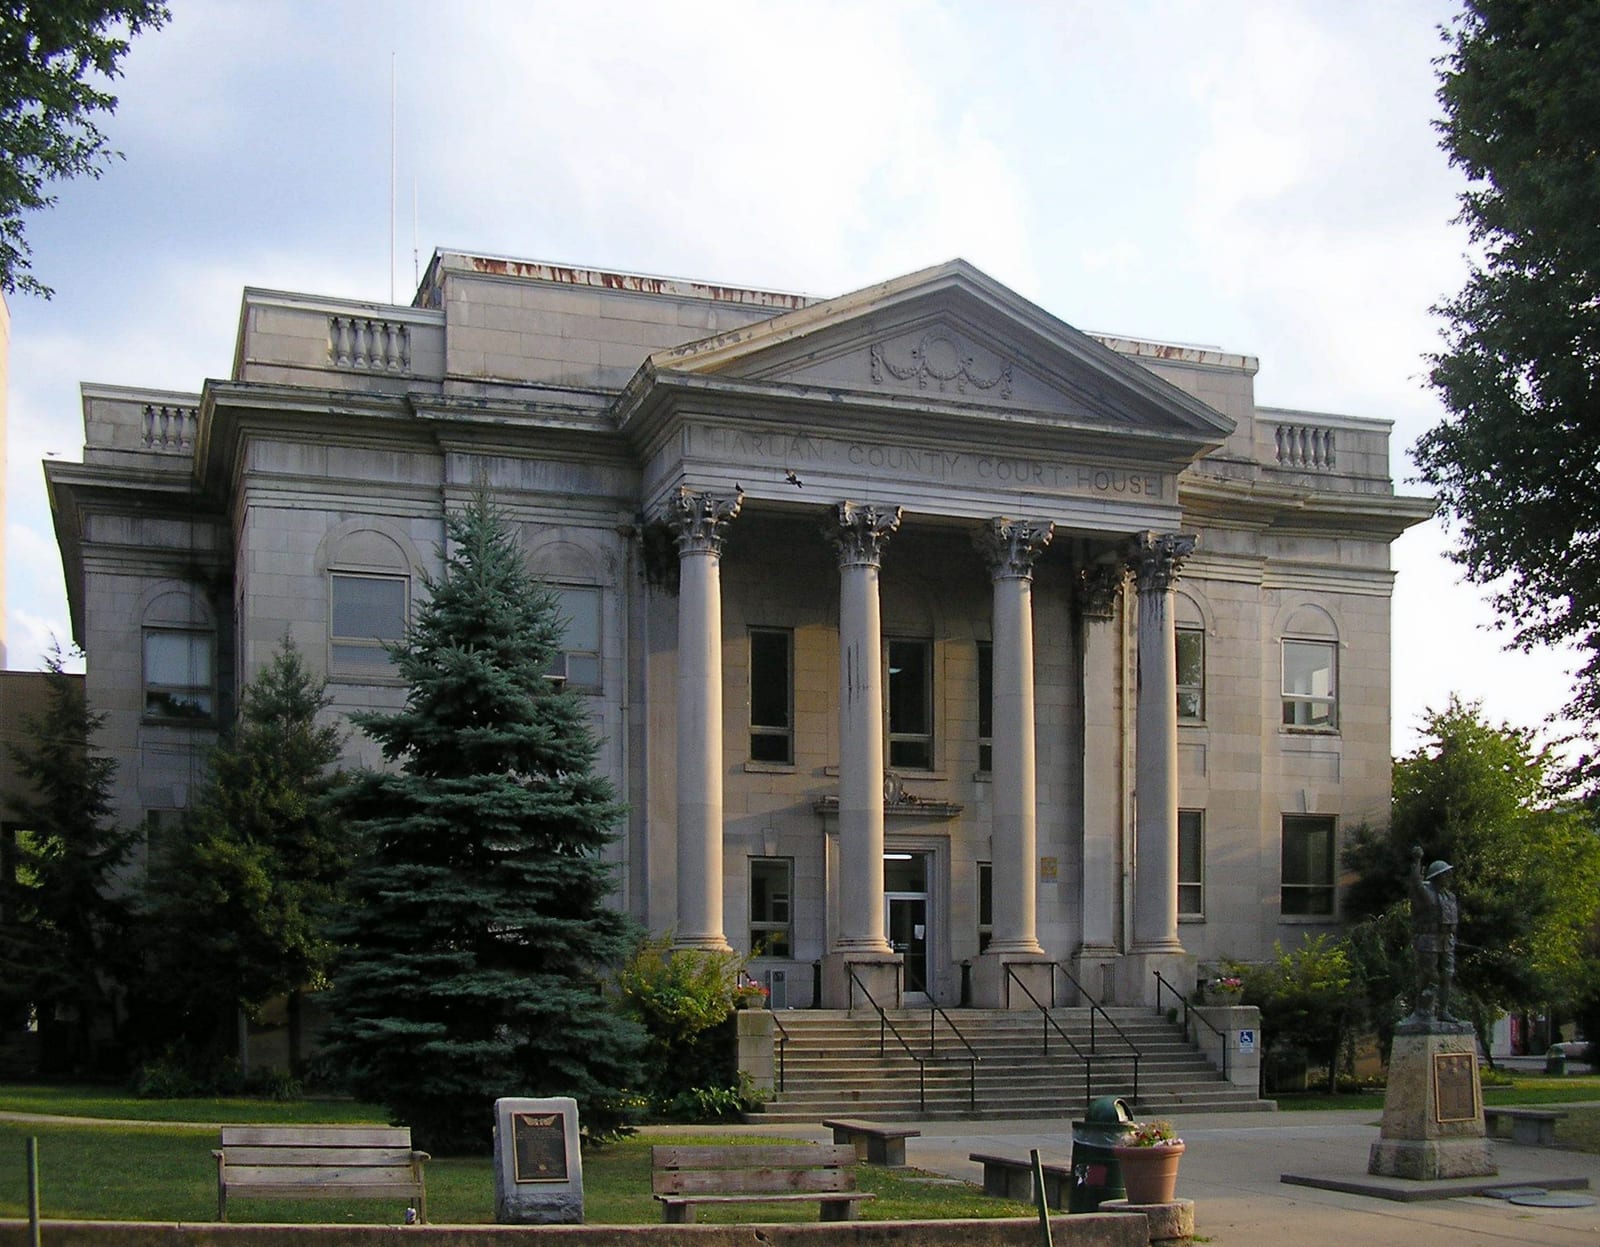
Harlan County, Kentucky: Evangelical Deep South county. In 2024, voted R+76%. Republican peak: R+76 in 2024.
Key facts
- 2024 presidential margin
- R+76MIT Election Lab
- Political typology
- Evangelical Deep SouthAkashic typology
- Population
- 25,7722024 5-year
- Median household income
- $41,6932024 5-year
- White (non-Hispanic)
- 94.2%2024 5-year
- Black
- 1.3%2024 5-year
- Hispanic / Latino
- 0.5%2024 5-year
- Peak Democratic margin
- D+40 in 1964MIT Election Lab
- Peak Republican margin
- R+76 in 2024MIT Election Lab
- Most similar
- Bryan County, OK · similarity 1.00
| Donald Trump ✓Republican | 87.7% | 9,109 |
|---|---|---|
| Kamala HarrisDemocratic | 11.5% | 1,199 |
| OtherAll other candidates | 0.8% | 80 |
| Year | Margin (D minus R) |
|---|---|
| 1876 | No data |
| 1880 | No data |
| 1884 | No data |
| 1888 | No data |
| 1892 | −46.6% |
| 1896 | −68.0% |
| 1900 | −69.6% |
| 1904 | −66.7% |
| 1908 | −68.6% |
| 1912 | −14.9% |
| 1916 | −57.6% |
| 1920 | −60.8% |
| 1924 | −56.8% |
| 1928 | −51.0% |
| 1932 | −10.0% |
| 1936 | +19.1% |
| 1940 | +28.7% |
| 1944 | +15.8% |
| 1948 | +34.7% |
| 1952 | +15.8% |
| 1956 | −12.1% |
| 1960 | +10.3% |
| 1964 | +40.0% |
| 1968 | +13.9% |
| 1972 | −19.8% |
| 1976 | +22.3% |
| 1980 | +23.1% |
| 1984 | +4.8% |
| 1988 | +17.3% |
| 1992 | +23.2% |
| 1996 | +25.1% |
| 2000 | +3.7% |
| 2004 | −21.0% |
| 2008 | −46.2% |
| 2012 | −64.0% |
| 2016 | −72.1% |
| 2020 | −71.8% |
| 2024 | −76.1% |
| Year | Won | Margin | Democratic | Republican | Total |
|---|---|---|---|---|---|
| R | 1,199 | 9,109 | 10,388 | ||
| R | 1,494 | 9,367 | 10,971 | ||
| R | 1,372 | 9,129 | 10,757 | ||
| R | 1,830 | 8,652 | 10,657 | ||
| R | 2,586 | 7,165 | 9,914 | ||
| R | 4,332 | 6,659 | 11,070 | ||
| D | 5,365 | 4,980 | 10,535 | ||
| D | 5,874 | 3,337 | 10,127 | ||
| D | 6,796 | 3,970 | 12,203 | ||
| D | 7,341 | 5,166 | 12,576 | ||
| D | 7,663 | 6,959 | 14,762 | ||
| D | 8,798 | 5,460 | 14,457 | ||
| D | 7,300 | 4,624 | 12,006 | ||
| R | 4,349 | 6,527 | 10,985 | ||
| D | 6,389 | 4,572 | 13,077 | ||
| D | 9,394 | 4,025 | 13,428 | ||
| D | 9,211 | 7,485 | 16,696 | ||
| R | 6,915 | 8,820 | 15,761 | ||
| D | 10,025 | 7,284 | 17,330 | ||
| D | 9,158 | 4,402 | 13,710 | ||
| D | 8,000 | 5,815 | 13,838 | ||
| D | 10,582 | 5,859 | 16,483 | ||
| D | 11,060 | 7,510 | 18,570 | ||
| R | 9,091 | 11,118 | 20,254 | ||
| R | 3,958 | 12,251 | 16,246 | ||
| R | 2,133 | 9,634 | 13,208 | ||
| R | 1,805 | 7,493 | 9,351 | ||
| R | 690 | 2,670 | 3,435 | ||
| O | 345 | 612 | 1,788 | ||
| R | 252 | 1,392 | 1,662 | ||
| R | 286 | 1,446 | 1,738 | ||
| R | 280 | 1,577 | 1,863 | ||
| R | 216 | 1,189 | 1,430 | ||
| R | 231 | 674 | 950 | ||
| — | — | — | — | ||
| — | — | — | — | ||
| — | — | — | — | ||
| — | — | — | — |
Demographics
Harlan County's coal-mining identity has anchored dramatic partisan realignment: a county that voted reliably Democratic through the 1990s now posts presidential margins above 75 points Republican, among the widest in the nation.
The Republican margin here reached its widest at seventy-six points in 2024. Between 2020 and 2024 the county moved four points toward the Republican candidate; the 2024 margin was seventy-six points.
A median household income of $41,693, a 27% poverty rate, and a 94% non-Hispanic-white share describe the county. The county's voting pattern over the last decade is most similar to that of Bryan County and Wise County.
Compare two places, side by side
Twelve curated comparisons line up election history, demographics, and the divergence story for two places at a glance. Browse all comparisons →
Harlan County, Kentucky. Akashic. https://akashic.app/county/21095/. Accessed May 20, 2026. License: CC BY 4.0.