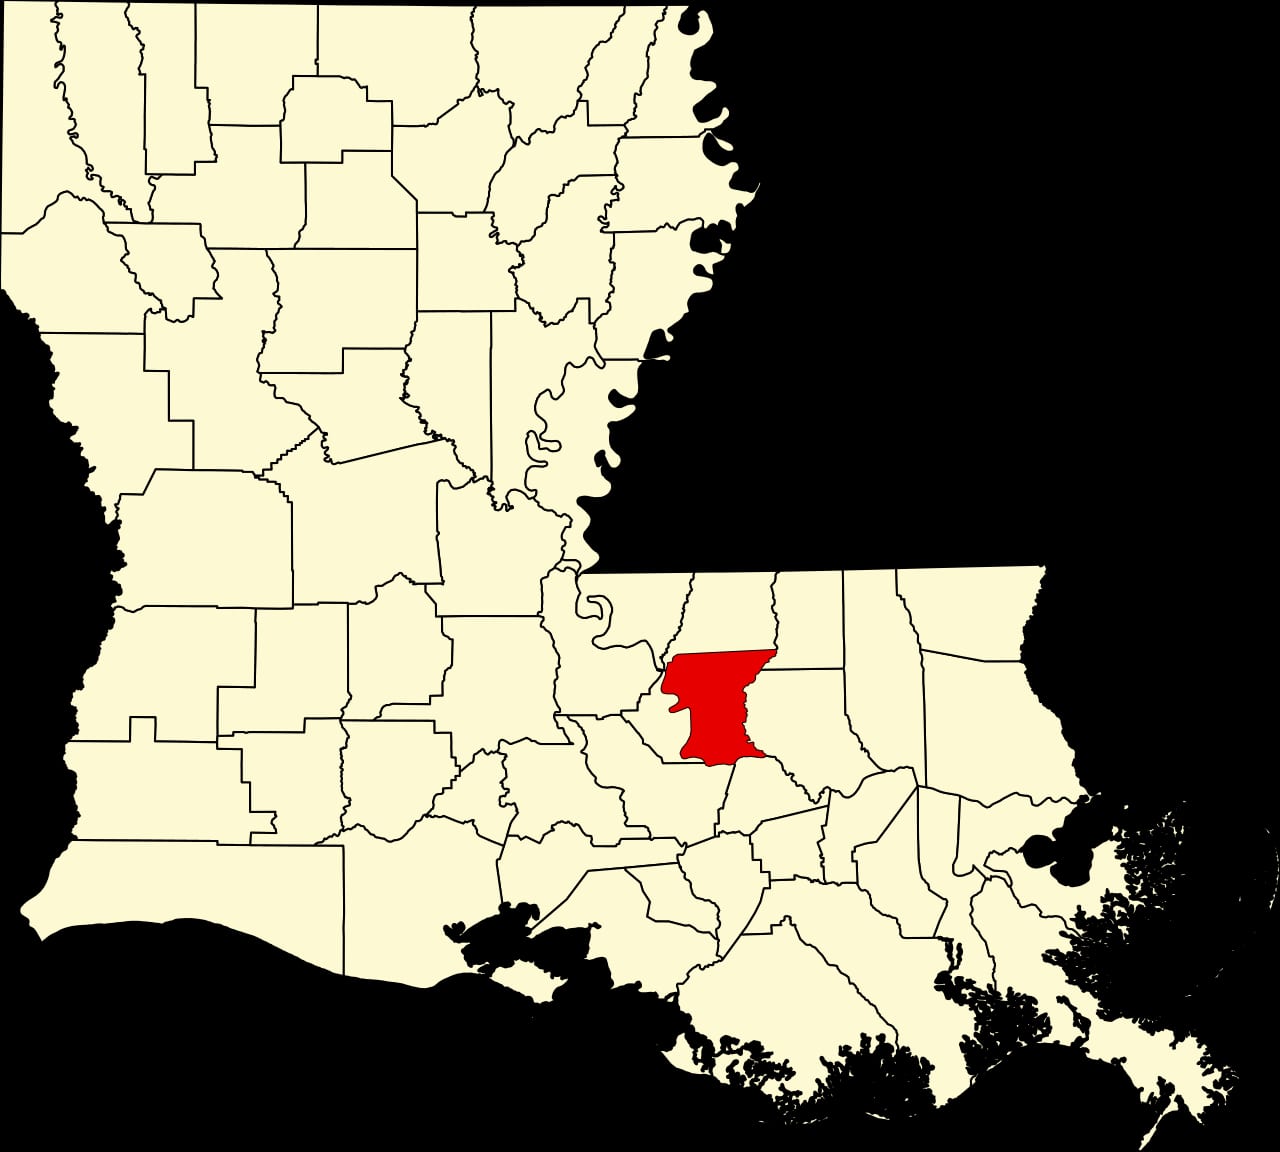
East Baton Rouge Parish, Louisiana: Industrial Catholic Metro county. In 2024, voted D+11%. Democratic peak: D+91 in 1904.
Key facts
- 2024 presidential margin
- D+11MIT Election Lab
- Political typology
- Industrial Catholic MetroAkashic typology
- Population
- 452,9382024 5-year
- Median household income
- $63,0712024 5-year
- White (non-Hispanic)
- 42.4%2024 5-year
- Black
- 43.7%2024 5-year
- Hispanic / Latino
- 6.9%2024 5-year
- Peak Democratic margin
- D+91 in 1904MIT Election Lab
- Peak Republican margin
- R+36 in 1972MIT Election Lab
- Most similar
- Jefferson County, AL · similarity 0.95
| Kamala Harris ✓Democratic | 54.5% | 103,820 |
|---|---|---|
| Donald TrumpRepublican | 43.4% | 82,720 |
| OtherAll other candidates | 2.2% | 4,103 |
| Year | Margin (D minus R) |
|---|---|
| 1876 | No data |
| 1880 | No data |
| 1884 | No data |
| 1888 | No data |
| 1892 | +36.4% |
| 1896 | +39.6% |
| 1900 | +69.8% |
| 1904 | +90.7% |
| 1908 | +84.3% |
| 1912 | +81.8% |
| 1916 | +82.1% |
| 1920 | +68.2% |
| 1924 | +63.4% |
| 1928 | +20.9% |
| 1932 | +71.5% |
| 1936 | +80.5% |
| 1940 | +76.6% |
| 1944 | +66.0% |
| 1948 | +18.5% |
| 1952 | +8.0% |
| 1956 | −16.4% |
| 1960 | +15.2% |
| 1964 | +17.1% |
| 1968 | +0.1% |
| 1972 | −36.0% |
| 1976 | −1.6% |
| 1980 | −10.2% |
| 1984 | −25.5% |
| 1988 | −18.6% |
| 1992 | −7.5% |
| 1996 | +3.3% |
| 2000 | −7.5% |
| 2004 | −9.6% |
| 2008 | +2.2% |
| 2012 | +5.2% |
| 2016 | +9.2% |
| 2020 | +13.0% |
| 2024 | +11.1% |
| Year | Won | Margin | Democratic | Republican | Total |
|---|---|---|---|---|---|
| D | 103,820 | 82,720 | 190,643 | ||
| D | 115,577 | 88,420 | 208,182 | ||
| D | 102,828 | 84,660 | 196,491 | ||
| D | 102,656 | 92,292 | 198,171 | ||
| D | 99,652 | 95,390 | 197,349 | ||
| R | 82,298 | 99,943 | 183,642 | ||
| R | 76,516 | 89,128 | 168,989 | ||
| D | 83,493 | 77,811 | 170,647 | ||
| R | 68,622 | 81,072 | 166,691 | ||
| R | 59,270 | 86,791 | 147,584 | ||
| R | 56,673 | 95,704 | 153,268 | ||
| R | 57,442 | 71,063 | 133,168 | ||
| R | 49,956 | 51,655 | 103,807 | ||
| R | 23,617 | 52,648 | 80,542 | ||
| O | 21,770 | 21,661 | 78,681 | ||
| D | 36,964 | 26,152 | 63,116 | ||
| D | 26,326 | 17,749 | 56,435 | ||
| R | 17,072 | 24,018 | 42,331 | ||
| D | 23,105 | 19,693 | 42,798 | ||
| D | 8,560 | 4,585 | 21,464 | ||
| D | 14,757 | 3,025 | 17,782 | ||
| D | 13,303 | 1,762 | 15,065 | ||
| D | 9,911 | 1,069 | 10,980 | ||
| D | 6,363 | 1,045 | 7,441 | ||
| D | 4,575 | 2,995 | 7,570 | ||
| D | 2,764 | 611 | 3,394 | ||
| D | 2,336 | 442 | 2,778 | ||
| D | 1,482 | 130 | 1,647 | ||
| D | 1,067 | 45 | 1,249 | ||
| D | 1,090 | 83 | 1,194 | ||
| D | 994 | 48 | 1,043 | ||
| D | 837 | 149 | 986 | ||
| D | 1,412 | 595 | 2,065 | ||
| D | 1,372 | 640 | 2,012 | ||
| — | — | — | — | ||
| — | — | — | — | ||
| — | — | — | — | ||
| — | — | — | — |
Demographics
Home to Baton Rouge and a majority-Black electorate, East Baton Rouge Parish has voted Democratic in presidential races by growing margins, anchored by state-government employment and two major university communities.
Its margins are typically close. The Democratic margin reached ninety-one points in 1904; the Republican margin reached thirty-six points in 1972. Between 2020 and 2024 the county moved two points toward the Republican candidate; the 2024 margin was eleven points.
Its demographics sit near national norms: a 42% non-Hispanic-white share, a median household income of $63,071, and a 20% poverty rate. The county's voting pattern over the last decade is most similar to that of Jefferson County and Somerset County.
Compare two places, side by side
Twelve curated comparisons line up election history, demographics, and the divergence story for two places at a glance. Browse all comparisons →
East Baton Rouge Parish, Louisiana. Akashic. https://akashic.app/county/22033/. Accessed May 20, 2026. License: CC BY 4.0.