Cecil County, Maryland: Industrial Catholic Metro county. In 2024, voted R+31%. Democratic peak: D+80 in 1912.
Key facts
- 2024 presidential margin
- R+31MIT Election Lab
- Political typology
- Industrial Catholic MetroAkashic typology
- Population
- 104,9602024 5-year
- Median household income
- $92,0072024 5-year
- White (non-Hispanic)
- 81.7%2024 5-year
- Black
- 7.2%2024 5-year
- Hispanic / Latino
- 5.6%2024 5-year
- Peak Democratic margin
- D+80 in 1912MIT Election Lab
- Peak Republican margin
- R+44 in 1928MIT Election Lab
- Most similar
- Horry County, SC · similarity 0.99
| Donald Trump ✓Republican | 64.1% | 33,871 |
|---|---|---|
| Kamala HarrisDemocratic | 33.4% | 17,628 |
| OtherAll other candidates | 2.5% | 1,332 |
| Year | Margin (D minus R) |
|---|---|
| 1876 | No data |
| 1880 | No data |
| 1884 | No data |
| 1888 | No data |
| 1892 | +10.8% |
| 1896 | −3.5% |
| 1900 | No data |
| 1904 | No data |
| 1908 | No data |
| 1912 | +79.6% |
| 1916 | +13.6% |
| 1920 | +0.5% |
| 1924 | −4.7% |
| 1928 | −44.0% |
| 1932 | +9.0% |
| 1936 | +15.1% |
| 1940 | +16.0% |
| 1944 | +11.8% |
| 1948 | +5.5% |
| 1952 | −7.4% |
| 1956 | −18.8% |
| 1960 | −9.7% |
| 1964 | +19.1% |
| 1968 | −13.7% |
| 1972 | −43.7% |
| 1976 | +6.7% |
| 1980 | −9.2% |
| 1984 | −32.3% |
| 1988 | −25.6% |
| 1992 | −2.0% |
| 1996 | −3.0% |
| 2000 | −11.0% |
| 2004 | −20.9% |
| 2008 | −14.6% |
| 2012 | −19.4% |
| 2016 | −34.0% |
| 2020 | −26.3% |
| 2024 | −30.7% |
| Year | Won | Margin | Democratic | Republican | Total |
|---|---|---|---|---|---|
| R | 17,628 | 33,871 | 52,831 | ||
| R | 16,809 | 29,439 | 47,939 | ||
| R | 13,650 | 28,868 | 44,752 | ||
| R | 16,557 | 24,806 | 42,480 | ||
| R | 17,665 | 23,855 | 42,494 | ||
| R | 14,680 | 22,556 | 37,674 | ||
| R | 12,327 | 15,494 | 28,876 | ||
| R | 10,144 | 10,885 | 24,460 | ||
| R | 10,232 | 10,784 | 27,319 | ||
| R | 7,807 | 13,224 | 21,155 | ||
| R | 6,681 | 13,111 | 19,885 | ||
| R | 7,937 | 9,673 | 18,846 | ||
| D | 8,950 | 7,833 | 16,783 | ||
| R | 4,113 | 10,759 | 15,191 | ||
| R | 4,517 | 6,462 | 14,214 | ||
| D | 7,854 | 5,330 | 13,184 | ||
| R | 6,065 | 7,368 | 13,433 | ||
| R | 4,936 | 7,217 | 12,153 | ||
| R | 5,590 | 6,482 | 12,098 | ||
| D | 4,323 | 3,866 | 8,236 | ||
| D | 4,662 | 3,680 | 8,342 | ||
| D | 5,360 | 3,878 | 9,288 | ||
| D | 4,914 | 3,617 | 8,582 | ||
| D | 4,282 | 3,569 | 7,959 | ||
| R | 2,201 | 5,706 | 7,962 | ||
| R | 2,863 | 3,156 | 6,266 | ||
| D | 3,468 | 3,435 | 6,957 | ||
| D | 2,587 | 1,959 | 4,627 | ||
| D | 5,280 | 1,509 | 4,736 | ||
| — | 5,037 | 2,847 | 55 | ||
| — | 6,066 | 2,425 | 58 | ||
| — | 2,988 | 2,959 | 24 | ||
| R | 2,908 | 3,128 | 6,230 | ||
| D | 2,898 | 2,310 | 5,459 | ||
| — | — | — | — | ||
| — | — | — | — | ||
| — | — | — | — | ||
| — | — | — | — |
Demographics
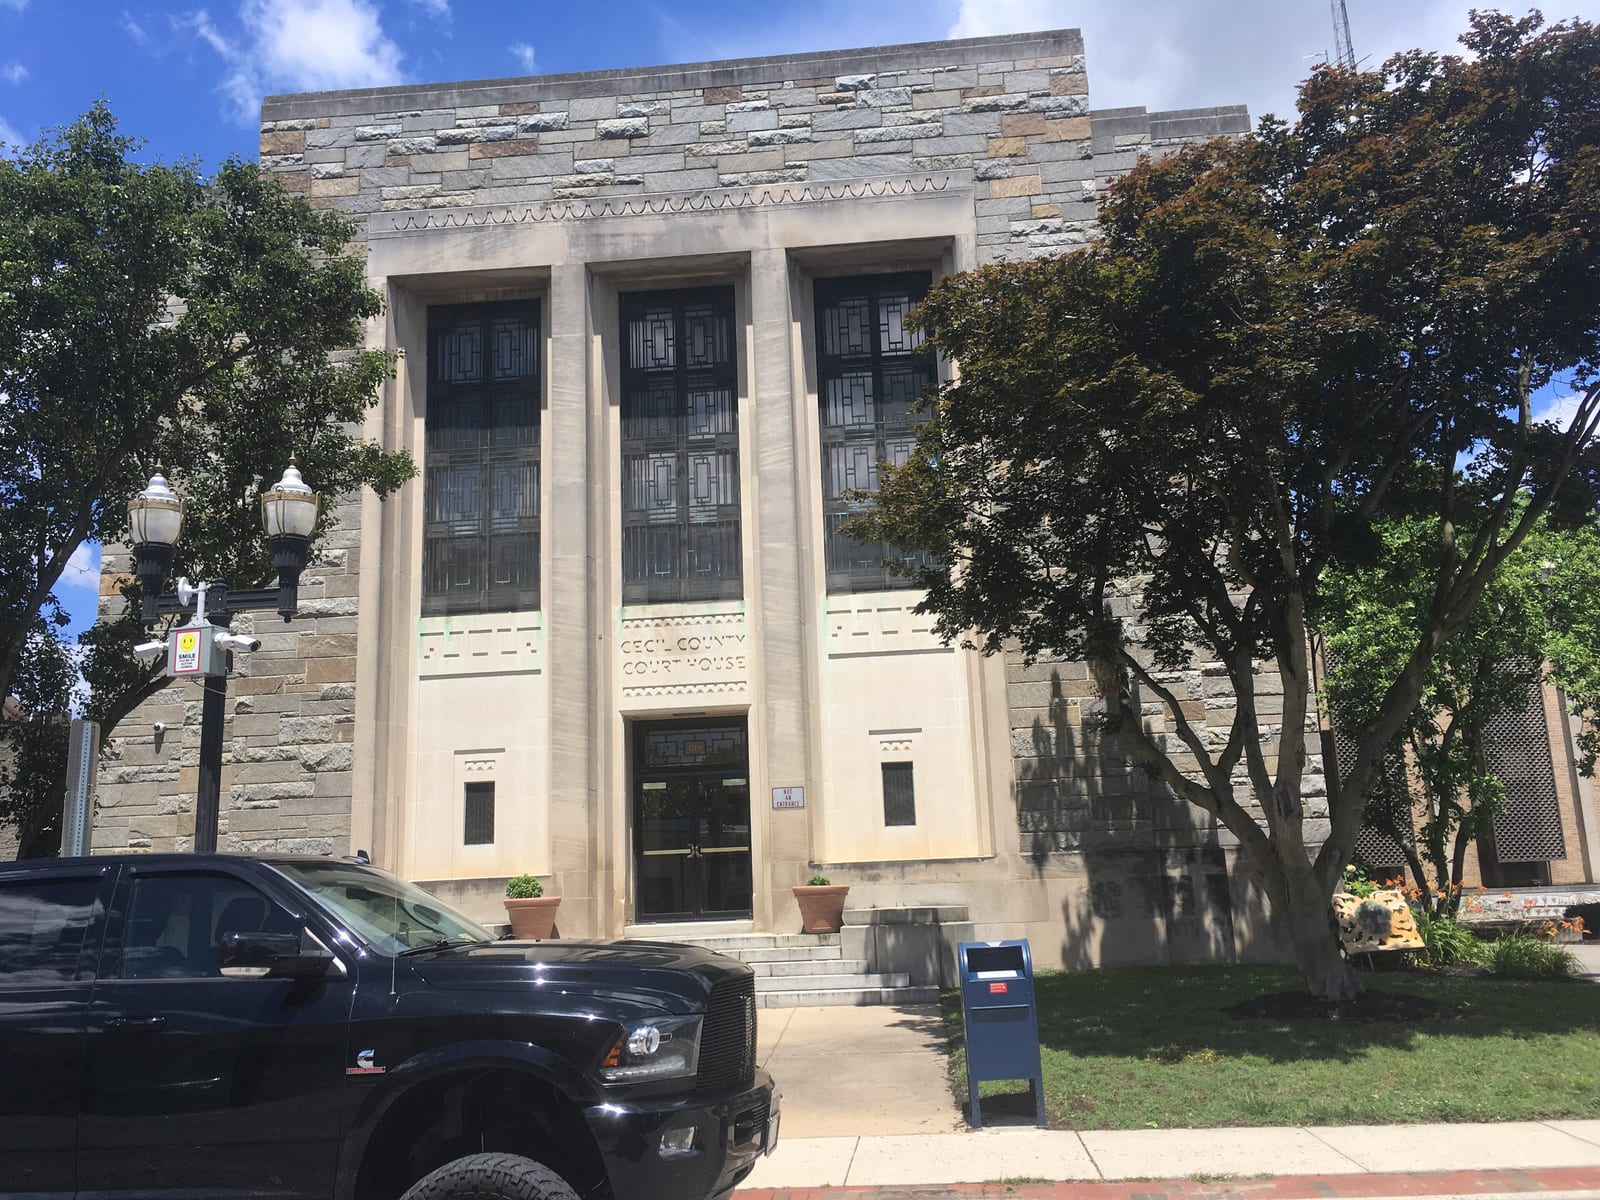
Cecil County sits at Maryland's northeastern corner, culturally and politically closer to neighboring Pennsylvania and Delaware's rural precincts than to the Baltimore suburbs. Its R+30.8 presidential margin in 2024 makes it one of the state's most reliably Republican jurisdictions.
Its margins are typically close. The Democratic margin reached eighty points in 1912; the Republican margin reached forty-four points in 1928. Between 2020 and 2024 the county moved four points toward the Republican candidate; the 2024 margin was thirty-one points.
Its demographics sit near national norms: a 82% non-Hispanic-white share, a median household income of $92,007, and a 11% poverty rate. The county's voting pattern over the last decade is most similar to that of Horry County and Tioga County.
Compare two places, side by side
Twelve curated comparisons line up election history, demographics, and the divergence story for two places at a glance. Browse all comparisons →
Cecil County, Maryland. Akashic. https://akashic.app/county/24015/. Accessed May 20, 2026. License: CC BY 4.0.