Berkshire County, Massachusetts: Industrial Catholic Metro county. In 2024, voted D+40%. Democratic peak: D+54 in 2012.
Key facts
- 2024 presidential margin
- D+40MIT Election Lab
- Political typology
- Industrial Catholic MetroAkashic typology
- Population
- 129,4302024 5-year
- Median household income
- $76,0132024 5-year
- White (non-Hispanic)
- 85.9%2024 5-year
- Black
- 2.6%2024 5-year
- Hispanic / Latino
- 5.9%2024 5-year
- Peak Democratic margin
- D+54 in 2012MIT Election Lab
- Peak Republican margin
- R+41 in 1896MIT Election Lab
- Most similar
- Cuyahoga County, OH · similarity 1.00
| Kamala Harris ✓Democratic | 68.6% | 47,094 |
|---|---|---|
| Donald TrumpRepublican | 28.8% | 19,805 |
| OtherAll other candidates | 2.6% | 1,775 |
| Year | Margin (D minus R) |
|---|---|
| 1876 | No data |
| 1880 | No data |
| 1884 | No data |
| 1888 | No data |
| 1892 | −4.4% |
| 1896 | −40.5% |
| 1900 | −23.6% |
| 1904 | −22.2% |
| 1908 | −20.2% |
| 1912 | −1.1% |
| 1916 | −7.6% |
| 1920 | −28.8% |
| 1924 | −28.3% |
| 1928 | +0.5% |
| 1932 | +0.1% |
| 1936 | +12.1% |
| 1940 | +11.3% |
| 1944 | +11.4% |
| 1948 | +5.4% |
| 1952 | −12.6% |
| 1956 | −23.9% |
| 1960 | +20.1% |
| 1964 | +52.4% |
| 1968 | +23.9% |
| 1972 | +7.6% |
| 1976 | +17.2% |
| 1980 | +3.5% |
| 1984 | −6.2% |
| 1988 | +22.4% |
| 1992 | +32.7% |
| 1996 | +43.2% |
| 2000 | +37.2% |
| 2004 | +47.4% |
| 2008 | +52.4% |
| 2012 | +53.6% |
| 2016 | +40.4% |
| 2020 | +46.9% |
| 2024 | +39.7% |
| Year | Won | Margin | Democratic | Republican | Total |
|---|---|---|---|---|---|
| D | 47,094 | 19,805 | 68,674 | ||
| D | 51,705 | 18,064 | 71,771 | ||
| D | 43,714 | 16,839 | 66,508 | ||
| D | 48,843 | 14,252 | 64,486 | ||
| D | 49,558 | 14,876 | 66,130 | ||
| D | 47,743 | 16,806 | 65,291 | ||
| D | 37,934 | 15,805 | 59,411 | ||
| D | 39,338 | 13,055 | 60,774 | ||
| D | 36,857 | 14,726 | 67,746 | ||
| D | 38,217 | 24,116 | 62,859 | ||
| R | 29,745 | 33,712 | 63,785 | ||
| D | 29,458 | 27,063 | 68,031 | ||
| D | 39,337 | 27,462 | 68,871 | ||
| D | 35,391 | 30,380 | 66,284 | ||
| D | 38,497 | 23,078 | 64,465 | ||
| D | 48,839 | 15,160 | 64,331 | ||
| D | 41,132 | 27,335 | 68,629 | ||
| R | 25,361 | 41,355 | 66,973 | ||
| R | 29,785 | 38,413 | 68,441 | ||
| D | 30,668 | 27,482 | 59,267 | ||
| D | 31,212 | 24,830 | 56,227 | ||
| D | 32,620 | 25,973 | 58,880 | ||
| D | 29,087 | 22,607 | 53,568 | ||
| D | 23,252 | 23,186 | 48,220 | ||
| D | 24,075 | 23,855 | 48,174 | ||
| R | 10,956 | 21,106 | 35,815 | ||
| R | 10,956 | 20,138 | 31,910 | ||
| R | 8,357 | 9,787 | 18,789 | ||
| R | 6,211 | 6,397 | 17,203 | ||
| R | 5,903 | 9,137 | 15,981 | ||
| R | 5,800 | 9,310 | 15,821 | ||
| R | 5,461 | 8,980 | 14,896 | ||
| R | 3,913 | 9,710 | 14,299 | ||
| R | 6,697 | 7,336 | 14,498 | ||
| — | — | — | — | ||
| — | — | — | — | ||
| — | — | — | — | ||
| — | — | — | — |
Demographics
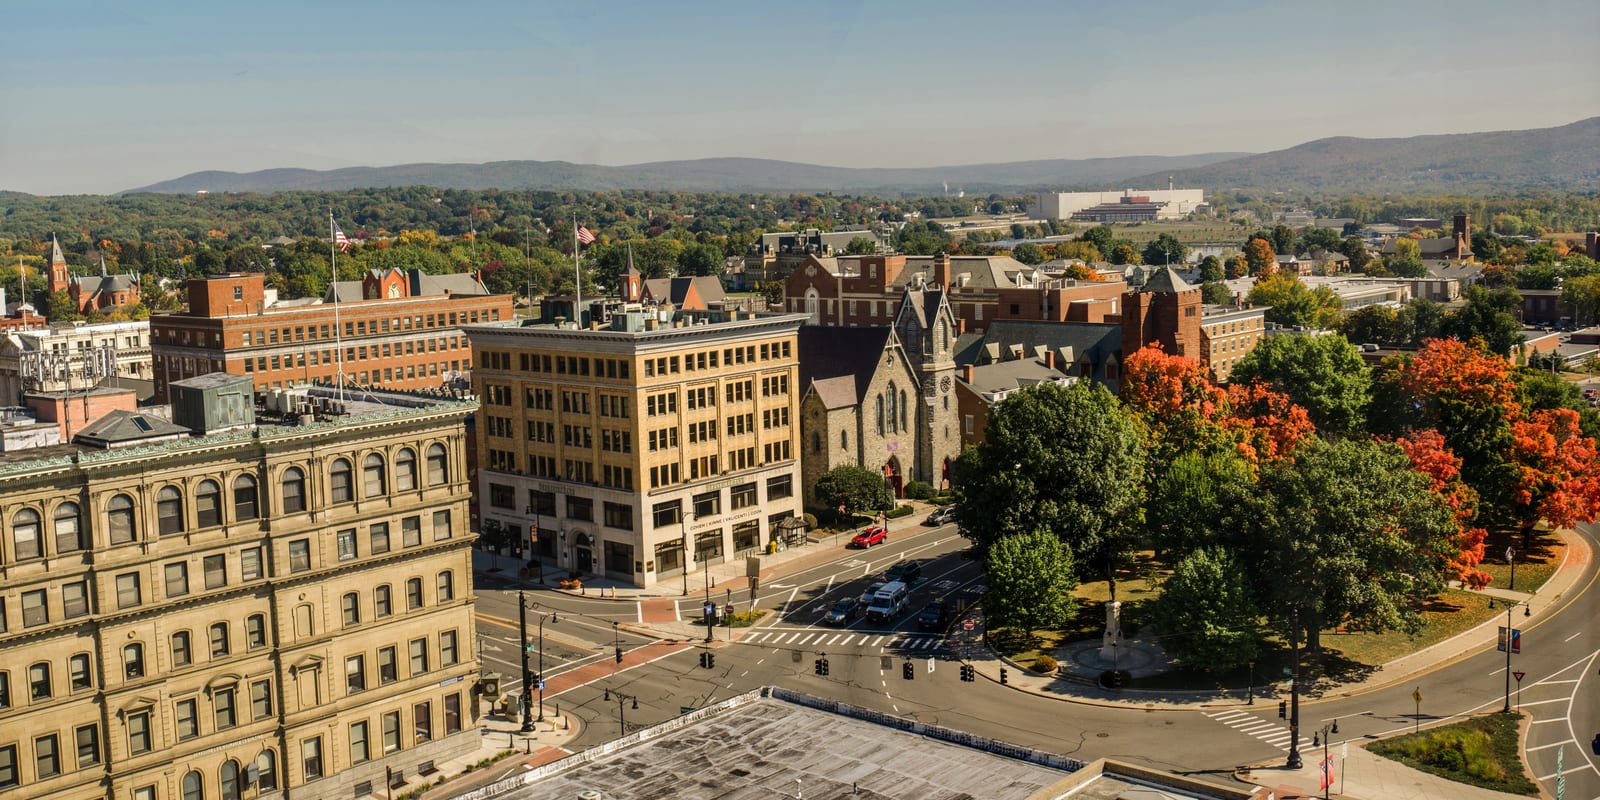
Despite its rural and post-industrial character, Berkshire County delivers Democratic presidential margins that rival dense urban cores, a pattern rooted in its arts-economy towns and a college presence anchored by Williams and Bard at Simon's Rock.
Its margins are typically close. The Democratic margin reached fifty-four points in 2012; the Republican margin reached forty-one points in 1896. Between 2020 and 2024 the county moved seven points toward the Republican candidate; the 2024 margin was forty points.
Its demographics sit near national norms: a 86% non-Hispanic-white share, a median household income of $76,013, and a 11% poverty rate. The county's voting pattern over the last decade is most similar to that of Cuyahoga County and Philadelphia County.
Compare two places, side by side
Twelve curated comparisons line up election history, demographics, and the divergence story for two places at a glance. Browse all comparisons →
Berkshire County, Massachusetts. Akashic. https://akashic.app/county/25003/. Accessed May 20, 2026. License: CC BY 4.0.