Cuyahoga County, Ohio: Industrial Catholic Metro county. In 2024, voted D+31%. Democratic peak: D+43 in 1964.
Key facts
- 2024 presidential margin
- D+31MIT Election Lab
- Political typology
- Industrial Catholic MetroAkashic typology
- Population
- 1,245,8732024 5-year
- Median household income
- $64,4682024 5-year
- White (non-Hispanic)
- 57.7%2024 5-year
- Black
- 28.9%2024 5-year
- Hispanic / Latino
- 7.0%2024 5-year
- Peak Democratic margin
- D+43 in 1964MIT Election Lab
- Peak Republican margin
- R+40 in 1924MIT Election Lab
- Most similar
- Berkshire County, MA · similarity 1.00
| Kamala Harris ✓Democratic | 64.7% | 376,385 |
|---|---|---|
| Donald TrumpRepublican | 33.6% | 195,165 |
| OtherAll other candidates | 1.7% | 9,965 |
| Year | Margin (D minus R) |
|---|---|
| 1876 | No data |
| 1880 | No data |
| 1884 | No data |
| 1888 | No data |
| 1892 | +4.9% |
| 1896 | −6.7% |
| 1900 | −3.2% |
| 1904 | −36.3% |
| 1908 | −16.1% |
| 1912 | +28.7% |
| 1916 | +15.7% |
| 1920 | −33.9% |
| 1924 | −40.2% |
| 1928 | −7.8% |
| 1932 | +5.2% |
| 1936 | +38.3% |
| 1940 | +24.8% |
| 1944 | +20.6% |
| 1948 | +8.8% |
| 1952 | −0.7% |
| 1956 | −7.4% |
| 1960 | +19.7% |
| 1964 | +43.0% |
| 1968 | +18.5% |
| 1972 | −1.8% |
| 1976 | +15.0% |
| 1980 | +8.6% |
| 1984 | +12.1% |
| 1988 | +18.5% |
| 1992 | +23.5% |
| 1996 | +31.6% |
| 2000 | +29.2% |
| 2004 | +33.7% |
| 2008 | +38.7% |
| 2012 | +39.5% |
| 2016 | +34.7% |
| 2020 | +34.1% |
| 2024 | +31.2% |
| Year | Won | Margin | Democratic | Republican | Total |
|---|---|---|---|---|---|
| D | 376,385 | 195,165 | 581,515 | ||
| D | 416,176 | 202,699 | 625,670 | ||
| D | 398,271 | 184,211 | 617,350 | ||
| D | 447,273 | 190,660 | 650,437 | ||
| D | 458,422 | 199,880 | 667,299 | ||
| D | 448,503 | 221,600 | 673,777 | ||
| D | 359,913 | 192,099 | 574,782 | ||
| D | 341,357 | 163,770 | 561,892 | ||
| D | 337,548 | 187,186 | 640,241 | ||
| D | 353,401 | 242,439 | 601,117 | ||
| D | 362,626 | 284,094 | 651,633 | ||
| D | 307,448 | 254,883 | 614,682 | ||
| D | 349,186 | 255,594 | 623,222 | ||
| R | 317,670 | 329,493 | 659,751 | ||
| D | 363,540 | 238,791 | 673,839 | ||
| D | 492,911 | 196,436 | 689,347 | ||
| D | 429,030 | 288,056 | 717,086 | ||
| R | 304,558 | 353,474 | 658,032 | ||
| R | 324,962 | 329,465 | 654,427 | ||
| D | 257,958 | 214,889 | 490,628 | ||
| D | 330,659 | 217,824 | 548,483 | ||
| D | 347,118 | 209,070 | 556,188 | ||
| D | 311,117 | 128,947 | 475,418 | ||
| D | 185,731 | 166,337 | 370,578 | ||
| R | 166,188 | 194,508 | 364,108 | ||
| R | 24,000 | 130,169 | 264,066 | ||
| R | 70,518 | 148,857 | 231,279 | ||
| D | 71,533 | 51,287 | 128,900 | ||
| O | 43,610 | 14,176 | 102,624 | ||
| R | 39,954 | 56,344 | 101,729 | ||
| R | 24,202 | 57,367 | 91,256 | ||
| R | 42,440 | 45,299 | 90,288 | ||
| R | 37,542 | 42,993 | 81,490 | ||
| D | 29,543 | 26,657 | 58,414 | ||
| — | — | — | — | ||
| — | — | — | — | ||
| — | — | — | — | ||
| — | — | — | — |
Demographics
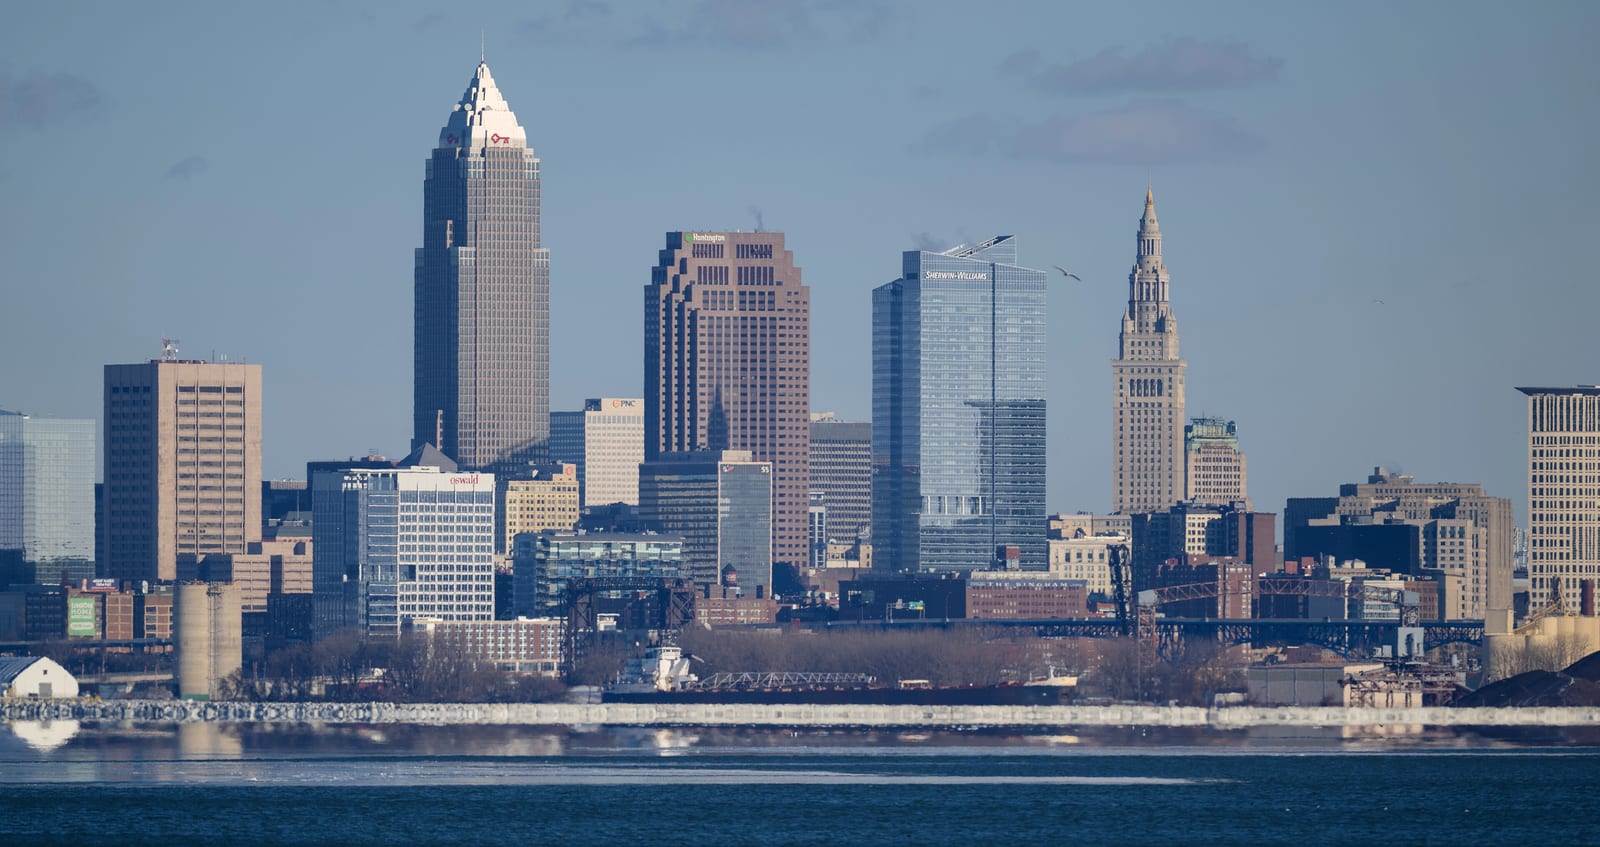
Home to Cleveland and a dense ring of inner suburbs, Cuyahoga delivers reliably lopsided Democratic presidential margins — D+31.4 in 2024 — making it the single largest vote reservoir for statewide Democratic candidates in Ohio.
Its margins are typically close. The Democratic margin reached forty-three points in 1964; the Republican margin reached forty points in 1924. Between 2020 and 2024 the county moved three points toward the Republican candidate; the 2024 margin was thirty-one points.
Its demographics sit near national norms: a 58% non-Hispanic-white share, a median household income of $64,468, and a 16% poverty rate. The county's voting pattern over the last decade is most similar to that of Berkshire County and Philadelphia County.
Compare two places, side by side
Twelve curated comparisons line up election history, demographics, and the divergence story for two places at a glance. Browse all comparisons →
Cuyahoga County, Ohio. Akashic. https://akashic.app/county/39035/. Accessed May 20, 2026. License: CC BY 4.0.