Phillips County, Montana: Stable Rural Right county. In 2024, voted R+62%. Republican peak: R+65 in 2016.
Key facts
- 2024 presidential margin
- R+62MIT Election Lab
- Political typology
- Stable Rural RightAkashic typology
- Population
- 4,2212024 5-year
- Median household income
- $53,4172024 5-year
- White (non-Hispanic)
- 81.1%2024 5-year
- Black
- 0.8%2024 5-year
- Hispanic / Latino
- 1.1%2024 5-year
- Peak Democratic margin
- D+49 in 1936MIT Election Lab
- Peak Republican margin
- R+65 in 2016MIT Election Lab
- Most similar
- Lincoln County, WA · similarity 1.00
| Donald Trump ✓Republican | 80.1% | 1,753 |
|---|---|---|
| Kamala HarrisDemocratic | 17.6% | 385 |
| OtherAll other candidates | 2.3% | 51 |
| Year | Margin (D minus R) |
|---|---|
| 1876 | No data |
| 1880 | No data |
| 1884 | No data |
| 1888 | No data |
| 1892 | No data |
| 1896 | No data |
| 1900 | No data |
| 1904 | No data |
| 1908 | No data |
| 1912 | No data |
| 1916 | +10.7% |
| 1920 | −41.4% |
| 1924 | −28.8% |
| 1928 | −19.0% |
| 1932 | +27.9% |
| 1936 | +48.8% |
| 1940 | +33.1% |
| 1944 | +13.6% |
| 1948 | +21.1% |
| 1952 | −18.1% |
| 1956 | −5.9% |
| 1960 | −0.1% |
| 1964 | +13.0% |
| 1968 | −9.6% |
| 1972 | −32.5% |
| 1976 | −9.3% |
| 1980 | −36.9% |
| 1984 | −41.7% |
| 1988 | −23.0% |
| 1992 | −14.9% |
| 1996 | −27.4% |
| 2000 | −58.5% |
| 2004 | −56.3% |
| 2008 | −37.0% |
| 2012 | −54.6% |
| 2016 | −64.7% |
| 2020 | −63.8% |
| 2024 | −62.5% |
| Year | Won | Margin | Democratic | Republican | Total |
|---|---|---|---|---|---|
| R | 385 | 1,753 | 2,189 | ||
| R | 416 | 1,936 | 2,382 | ||
| R | 318 | 1,723 | 2,171 | ||
| R | 471 | 1,688 | 2,228 | ||
| R | 638 | 1,423 | 2,123 | ||
| R | 456 | 1,677 | 2,170 | ||
| R | 423 | 1,727 | 2,228 | ||
| R | 705 | 1,392 | 2,511 | ||
| R | 634 | 1,026 | 2,625 | ||
| R | 905 | 1,462 | 2,426 | ||
| R | 787 | 1,934 | 2,749 | ||
| R | 745 | 1,723 | 2,653 | ||
| R | 1,117 | 1,347 | 2,486 | ||
| R | 828 | 1,659 | 2,557 | ||
| R | 1,100 | 1,353 | 2,632 | ||
| D | 1,612 | 1,242 | 2,857 | ||
| R | 1,455 | 1,457 | 2,925 | ||
| R | 1,427 | 1,605 | 3,032 | ||
| R | 1,224 | 1,771 | 3,017 | ||
| D | 1,506 | 964 | 2,569 | ||
| D | 1,435 | 1,089 | 2,543 | ||
| D | 2,225 | 1,110 | 3,366 | ||
| D | 2,555 | 850 | 3,494 | ||
| D | 2,054 | 1,127 | 3,324 | ||
| R | 1,135 | 1,671 | 2,828 | ||
| R | 473 | 1,236 | 2,647 | ||
| R | 648 | 1,693 | 2,522 | ||
| D | 1,252 | 999 | 2,355 | ||
| — | — | — | — | ||
| — | — | — | — | ||
| — | — | — | — | ||
| — | — | — | — | ||
| — | — | — | — | ||
| — | — | — | — | ||
| — | — | — | — | ||
| — | — | — | — | ||
| — | — | — | — | ||
| — | — | — | — |
Demographics
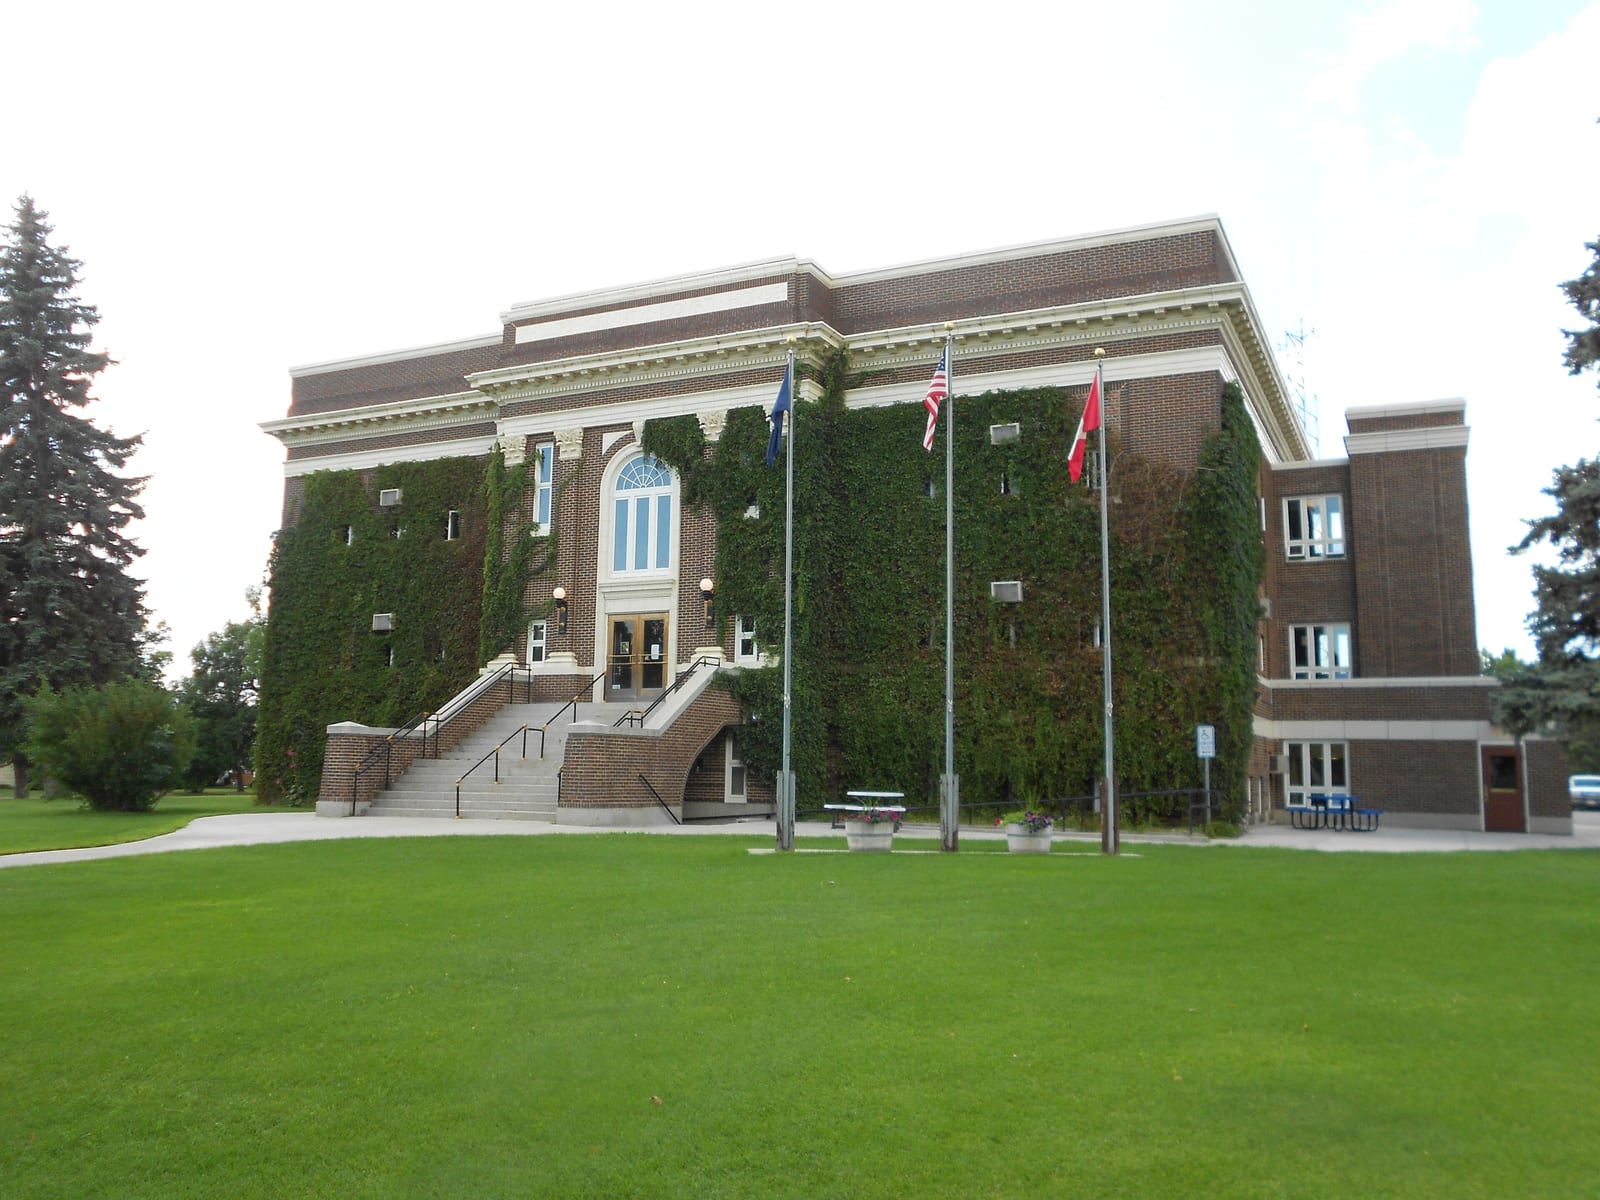
Phillips County's vast Hi-Line rangelands and a population under 5,000 produce some of the most consistent Republican margins in the state, with the 2024 presidential race decided by more than 62 points.
The Republican margin here reached sixty-five points in 2016. Between 2020 and 2024 the county moved one point toward the Democratic candidate; the 2024 margin was sixty-two points.
A population of 4,221, a 81% non-Hispanic-white share, and a median household income of $53,417 describe the county. The county's voting pattern over the last decade is most similar to that of Lincoln County and Judith Basin County.
Compare two places, side by side
Twelve curated comparisons line up election history, demographics, and the divergence story for two places at a glance. Browse all comparisons →
Phillips County, Montana. Akashic. https://akashic.app/county/30071/. Accessed May 20, 2026. License: CC BY 4.0.