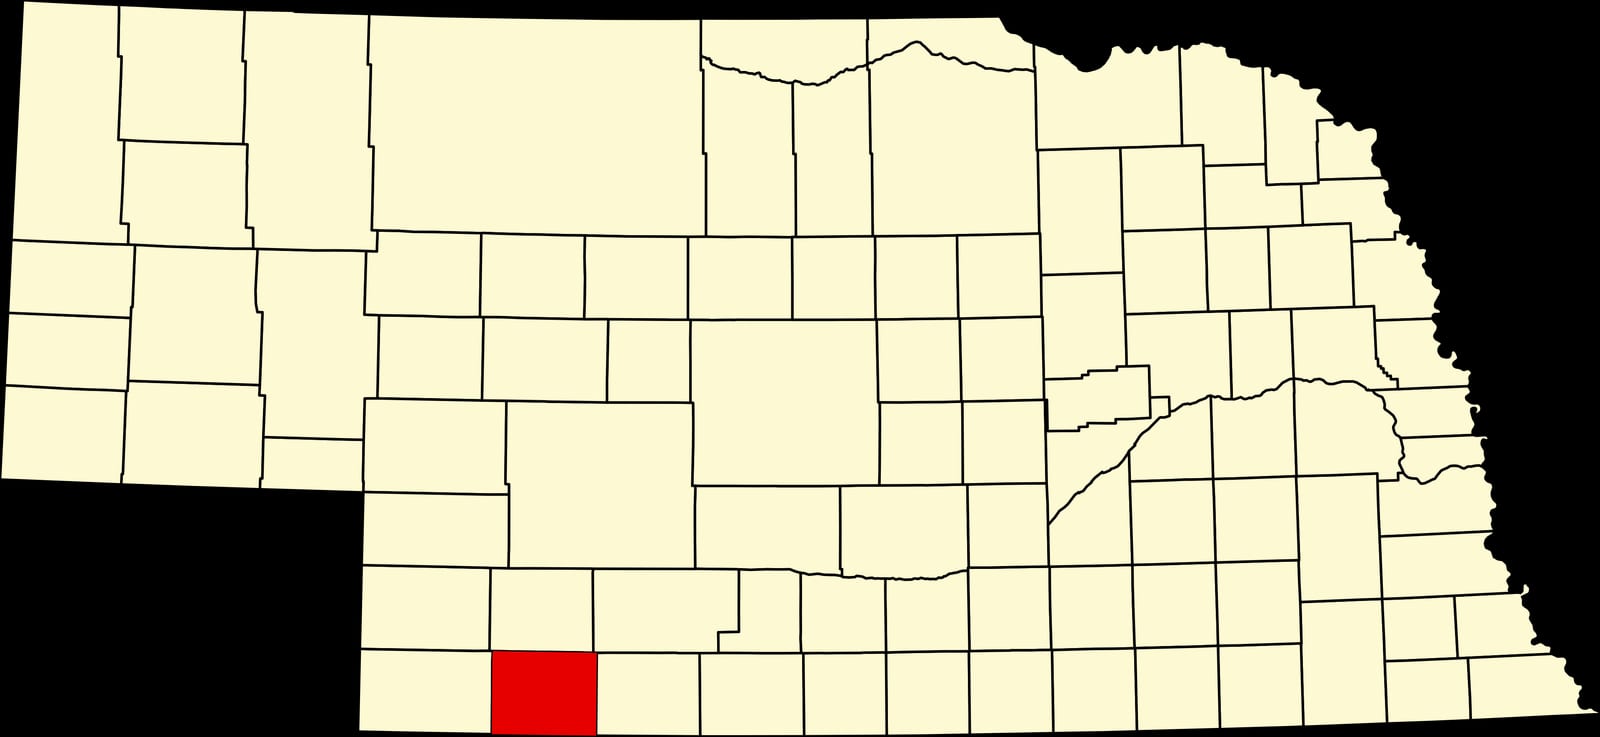
Hitchcock County, Nebraska: Evangelical Deep South county. In 2024, voted R+78%. Republican peak: R+78 in 2024.
Key facts
- 2024 presidential margin
- R+78MIT Election Lab
- Political typology
- Evangelical Deep SouthAkashic typology
- Population
- 2,5692024 5-year
- Median household income
- $51,5672024 5-year
- White (non-Hispanic)
- 94.3%2024 5-year
- Black
- 0.0%2024 5-year
- Hispanic / Latino
- 4.2%2024 5-year
- Peak Democratic margin
- D+34 in 1892MIT Election Lab
- Peak Republican margin
- R+78 in 2024MIT Election Lab
- Most similar
- Morrill County, NE · similarity 1.00
| Donald Trump ✓Republican | 88.2% | 1,269 |
|---|---|---|
| Kamala HarrisDemocratic | 10.6% | 152 |
| OtherAll other candidates | 1.3% | 18 |
| Year | Margin (D minus R) |
|---|---|
| 1876 | No data |
| 1880 | No data |
| 1884 | No data |
| 1888 | No data |
| 1892 | +33.8% |
| 1896 | +7.2% |
| 1900 | +7.9% |
| 1904 | −44.1% |
| 1908 | −0.1% |
| 1912 | +32.5% |
| 1916 | +24.8% |
| 1920 | −28.0% |
| 1924 | −16.4% |
| 1928 | −48.3% |
| 1932 | +20.2% |
| 1936 | +14.9% |
| 1940 | −16.7% |
| 1944 | −27.9% |
| 1948 | −13.4% |
| 1952 | −50.0% |
| 1956 | −35.9% |
| 1960 | −41.3% |
| 1964 | −9.7% |
| 1968 | −44.8% |
| 1972 | −57.3% |
| 1976 | −6.5% |
| 1980 | −58.3% |
| 1984 | −60.4% |
| 1988 | −40.0% |
| 1992 | −26.9% |
| 1996 | −36.2% |
| 2000 | −55.0% |
| 2004 | −58.9% |
| 2008 | −47.5% |
| 2012 | −60.5% |
| 2016 | −73.0% |
| 2020 | −74.1% |
| 2024 | −77.6% |
| Year | Won | Margin | Democratic | Republican | Total |
|---|---|---|---|---|---|
| R | 152 | 1,269 | 1,439 | ||
| R | 175 | 1,264 | 1,470 | ||
| R | 161 | 1,232 | 1,468 | ||
| R | 274 | 1,178 | 1,495 | ||
| R | 346 | 1,001 | 1,379 | ||
| R | 296 | 1,171 | 1,486 | ||
| R | 312 | 1,126 | 1,480 | ||
| R | 409 | 977 | 1,569 | ||
| R | 359 | 824 | 1,731 | ||
| R | 480 | 1,132 | 1,630 | ||
| R | 341 | 1,391 | 1,739 | ||
| R | 329 | 1,474 | 1,963 | ||
| R | 786 | 898 | 1,732 | ||
| R | 364 | 1,339 | 1,703 | ||
| R | 387 | 1,173 | 1,753 | ||
| R | 946 | 1,149 | 2,095 | ||
| R | 678 | 1,634 | 2,312 | ||
| R | 741 | 1,570 | 2,311 | ||
| R | 669 | 2,008 | 2,677 | ||
| R | 923 | 1,208 | 2,131 | ||
| R | 877 | 1,556 | 2,433 | ||
| R | 1,188 | 1,663 | 2,851 | ||
| D | 1,738 | 1,285 | 3,045 | ||
| D | 1,772 | 1,168 | 2,983 | ||
| R | 698 | 2,022 | 2,743 | ||
| R | 633 | 987 | 2,155 | ||
| R | 615 | 1,127 | 1,830 | ||
| D | 733 | 435 | 1,203 | ||
| D | 471 | 128 | 1,057 | ||
| R | 632 | 633 | 1,296 | ||
| R | 166 | 598 | 979 | ||
| D | 528 | 450 | 992 | ||
| D | 487 | 421 | 918 | ||
| O | 495 | 76 | 1,238 | ||
| — | — | — | — | ||
| — | — | — | — | ||
| — | — | — | — | ||
| — | — | — | — |
Demographics
With roughly 3,100 residents spread across the Republican Platte River shortgrass plains, Hitchcock County recorded a 78-point presidential margin in 2024—among the widest in the state and a signal of how consolidation in rural agricultural counties has accelerated over recent cycles.
The Republican margin here reached its widest at seventy-eight points in 2024. Between 2020 and 2024 the county moved four points toward the Republican candidate; the 2024 margin was seventy-eight points.
A median household income of $51,567, a 13% poverty rate, and a 94% non-Hispanic-white share describe the county. The county's voting pattern over the last decade is most similar to that of Morrill County and Furnas County.
Compare two places, side by side
Twelve curated comparisons line up election history, demographics, and the divergence story for two places at a glance. Browse all comparisons →
Hitchcock County, Nebraska. Akashic. https://akashic.app/county/31087/. Accessed May 20, 2026. License: CC BY 4.0.