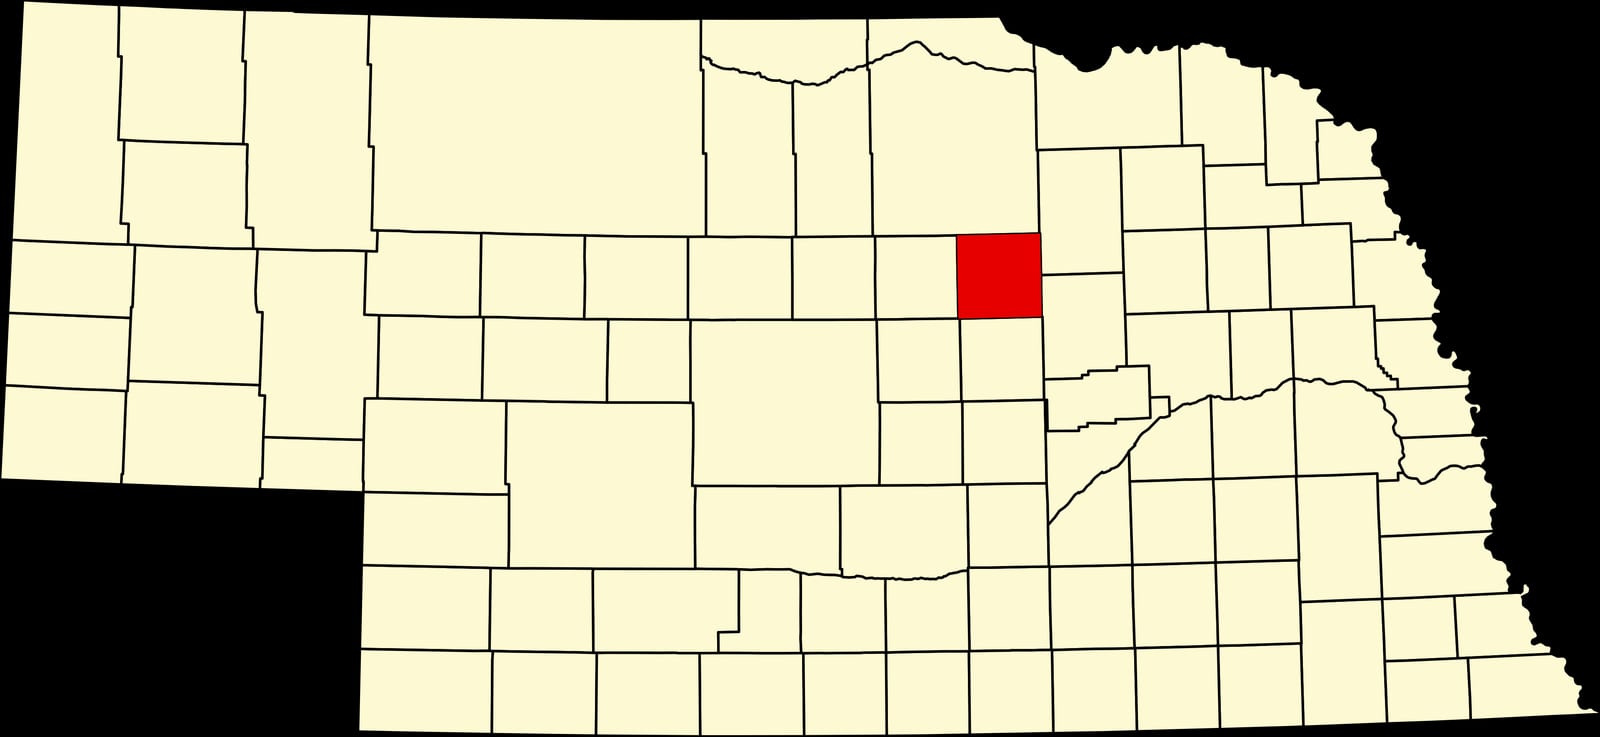
Wheeler County, Nebraska: Farm Belt county. In 2024, voted R+76%. Republican peak: R+76 in 2024.
Key facts
- 2024 presidential margin
- R+76MIT Election Lab
- Political typology
- Farm BeltAkashic typology
- Population
- 8472024 5-year
- Median household income
- $70,2502024 5-year
- White (non-Hispanic)
- 95.5%2024 5-year
- Black
- 0.0%2024 5-year
- Hispanic / Latino
- 3.8%2024 5-year
- Peak Democratic margin
- D+48 in 1932MIT Election Lab
- Peak Republican margin
- R+76 in 2024MIT Election Lab
- Most similar
- Boone County, NE · similarity 1.00
| Donald Trump ✓Republican | 87.2% | 424 |
|---|---|---|
| Kamala HarrisDemocratic | 11.7% | 57 |
| OtherAll other candidates | 1.0% | 5 |
| Year | Margin (D minus R) |
|---|---|
| 1876 | No data |
| 1880 | No data |
| 1884 | No data |
| 1888 | No data |
| 1892 | +30.4% |
| 1896 | +24.1% |
| 1900 | +13.0% |
| 1904 | −37.1% |
| 1908 | +3.1% |
| 1912 | +25.7% |
| 1916 | +21.7% |
| 1920 | −30.6% |
| 1924 | −7.9% |
| 1928 | −29.0% |
| 1932 | +48.5% |
| 1936 | +13.7% |
| 1940 | −7.4% |
| 1944 | −11.7% |
| 1948 | +10.7% |
| 1952 | −32.7% |
| 1956 | −28.4% |
| 1960 | −27.9% |
| 1964 | −12.2% |
| 1968 | −38.2% |
| 1972 | −62.2% |
| 1976 | −29.4% |
| 1980 | −56.1% |
| 1984 | −57.6% |
| 1988 | −36.9% |
| 1992 | −34.1% |
| 1996 | −32.3% |
| 2000 | −58.7% |
| 2004 | −62.9% |
| 2008 | −54.1% |
| 2012 | −56.3% |
| 2016 | −67.7% |
| 2020 | −75.3% |
| 2024 | −75.5% |
| Year | Won | Margin | Democratic | Republican | Total |
|---|---|---|---|---|---|
| R | 57 | 424 | 486 | ||
| R | 59 | 438 | 503 | ||
| R | 62 | 377 | 465 | ||
| R | 93 | 345 | 448 | ||
| R | 96 | 334 | 440 | ||
| R | 81 | 366 | 453 | ||
| R | 85 | 351 | 453 | ||
| R | 106 | 241 | 418 | ||
| R | 88 | 246 | 464 | ||
| R | 141 | 309 | 455 | ||
| R | 97 | 365 | 465 | ||
| R | 93 | 374 | 501 | ||
| R | 146 | 274 | 436 | ||
| R | 84 | 361 | 445 | ||
| R | 131 | 323 | 503 | ||
| R | 248 | 317 | 565 | ||
| R | 239 | 424 | 663 | ||
| R | 218 | 391 | 609 | ||
| R | 231 | 455 | 686 | ||
| D | 327 | 264 | 591 | ||
| R | 310 | 392 | 702 | ||
| R | 427 | 495 | 922 | ||
| D | 484 | 358 | 920 | ||
| D | 658 | 219 | 906 | ||
| R | 293 | 534 | 832 | ||
| O | 145 | 205 | 759 | ||
| R | 165 | 352 | 612 | ||
| D | 270 | 163 | 494 | ||
| O | 194 | 70 | 483 | ||
| D | 252 | 236 | 517 | ||
| R | 56 | 187 | 353 | ||
| D | 180 | 138 | 322 | ||
| D | 161 | 97 | 266 | ||
| O | 122 | 29 | 306 | ||
| — | — | — | — | ||
| — | — | — | — | ||
| — | — | — | — | ||
| — | — | — | — |
Demographics
Wheeler County's 886 residents delivered a 75-point Republican margin in 2024, a figure more common to uncontested races than genuine campaigns. Sparsely settled Sandhills ranching country, it has trended heavily Republican for decades.
The Republican margin here reached seventy-six points in 2024. The 2024 margin was seventy-six points.
A population of 847, a 96% non-Hispanic-white share, and a median household income of $70,250 describe an agricultural county. The county's voting pattern over the last decade is most similar to that of Boone County and Kimball County.
Compare two places, side by side
Twelve curated comparisons line up election history, demographics, and the divergence story for two places at a glance. Browse all comparisons →
Wheeler County, Nebraska. Akashic. https://akashic.app/county/31183/. Accessed May 20, 2026. License: CC BY 4.0.