Esmeralda County, Nevada: New American county. In 2024, voted R+66%. Democratic peak: D+70 in 1896.
Key facts
- 2024 presidential margin
- R+66MIT Election Lab
- Political typology
- New AmericanAkashic typology
- Population
- 1,0282024 5-year
- Median household income
- $41,7152024 5-year
- White (non-Hispanic)
- 71.0%2024 5-year
- Black
- 0.3%2024 5-year
- Hispanic / Latino
- 31.5%2024 5-year
- Peak Democratic margin
- D+70 in 1896MIT Election Lab
- Peak Republican margin
- R+67 in 2020MIT Election Lab
- Most similar
- Lincoln County, NV · similarity 1.00
| Donald Trump ✓Republican | 81.6% | 376 |
|---|---|---|
| Kamala HarrisDemocratic | 15.8% | 73 |
| OtherAll other candidates | 2.6% | 12 |
| Year | Margin (D minus R) |
|---|---|
| 1876 | No data |
| 1880 | No data |
| 1884 | No data |
| 1888 | No data |
| 1892 | −13.0% |
| 1896 | +70.4% |
| 1900 | +39.6% |
| 1904 | −9.5% |
| 1908 | +10.0% |
| 1912 | +25.3% |
| 1916 | +18.7% |
| 1920 | −12.7% |
| 1924 | −12.5% |
| 1928 | +5.6% |
| 1932 | +48.7% |
| 1936 | +56.8% |
| 1940 | +37.3% |
| 1944 | +19.6% |
| 1948 | +5.2% |
| 1952 | −11.2% |
| 1956 | −13.9% |
| 1960 | +15.9% |
| 1964 | +17.6% |
| 1968 | −5.7% |
| 1972 | −36.5% |
| 1976 | +7.9% |
| 1980 | −42.9% |
| 1984 | −45.6% |
| 1988 | −42.9% |
| 1992 | −17.6% |
| 1996 | −25.1% |
| 2000 | −44.2% |
| 2004 | −55.7% |
| 2008 | −46.6% |
| 2012 | −51.7% |
| 2016 | −62.4% |
| 2020 | −66.9% |
| 2024 | −65.7% |
| Year | Won | Margin | Democratic | Republican | Total |
|---|---|---|---|---|---|
| R | 73 | 376 | 461 | ||
| R | 74 | 400 | 487 | ||
| R | 65 | 329 | 423 | ||
| R | 92 | 317 | 435 | ||
| R | 104 | 303 | 427 | ||
| R | 99 | 367 | 481 | ||
| R | 116 | 333 | 491 | ||
| R | 140 | 277 | 546 | ||
| R | 118 | 221 | 584 | ||
| R | 143 | 380 | 552 | ||
| R | 158 | 453 | 647 | ||
| R | 110 | 311 | 469 | ||
| D | 214 | 181 | 416 | ||
| R | 127 | 273 | 400 | ||
| R | 118 | 138 | 353 | ||
| D | 187 | 131 | 318 | ||
| D | 215 | 156 | 371 | ||
| R | 124 | 164 | 288 | ||
| R | 139 | 174 | 313 | ||
| D | 183 | 164 | 365 | ||
| D | 223 | 150 | 373 | ||
| D | 639 | 292 | 931 | ||
| D | 566 | 156 | 722 | ||
| D | 426 | 147 | 573 | ||
| D | 341 | 305 | 646 | ||
| O | 150 | 241 | 726 | ||
| R | 347 | 466 | 940 | ||
| D | 1,135 | 709 | 2,281 | ||
| O | 713 | 252 | 1,825 | ||
| D | 2,787 | 2,208 | 5,784 | ||
| R | 380 | 490 | 1,161 | ||
| D | 289 | 125 | 414 | ||
| D | 397 | 69 | 466 | ||
| O | 19 | 84 | 499 | ||
| — | — | — | — | ||
| — | — | — | — | ||
| — | — | — | — | ||
| — | — | — | — |
Demographics
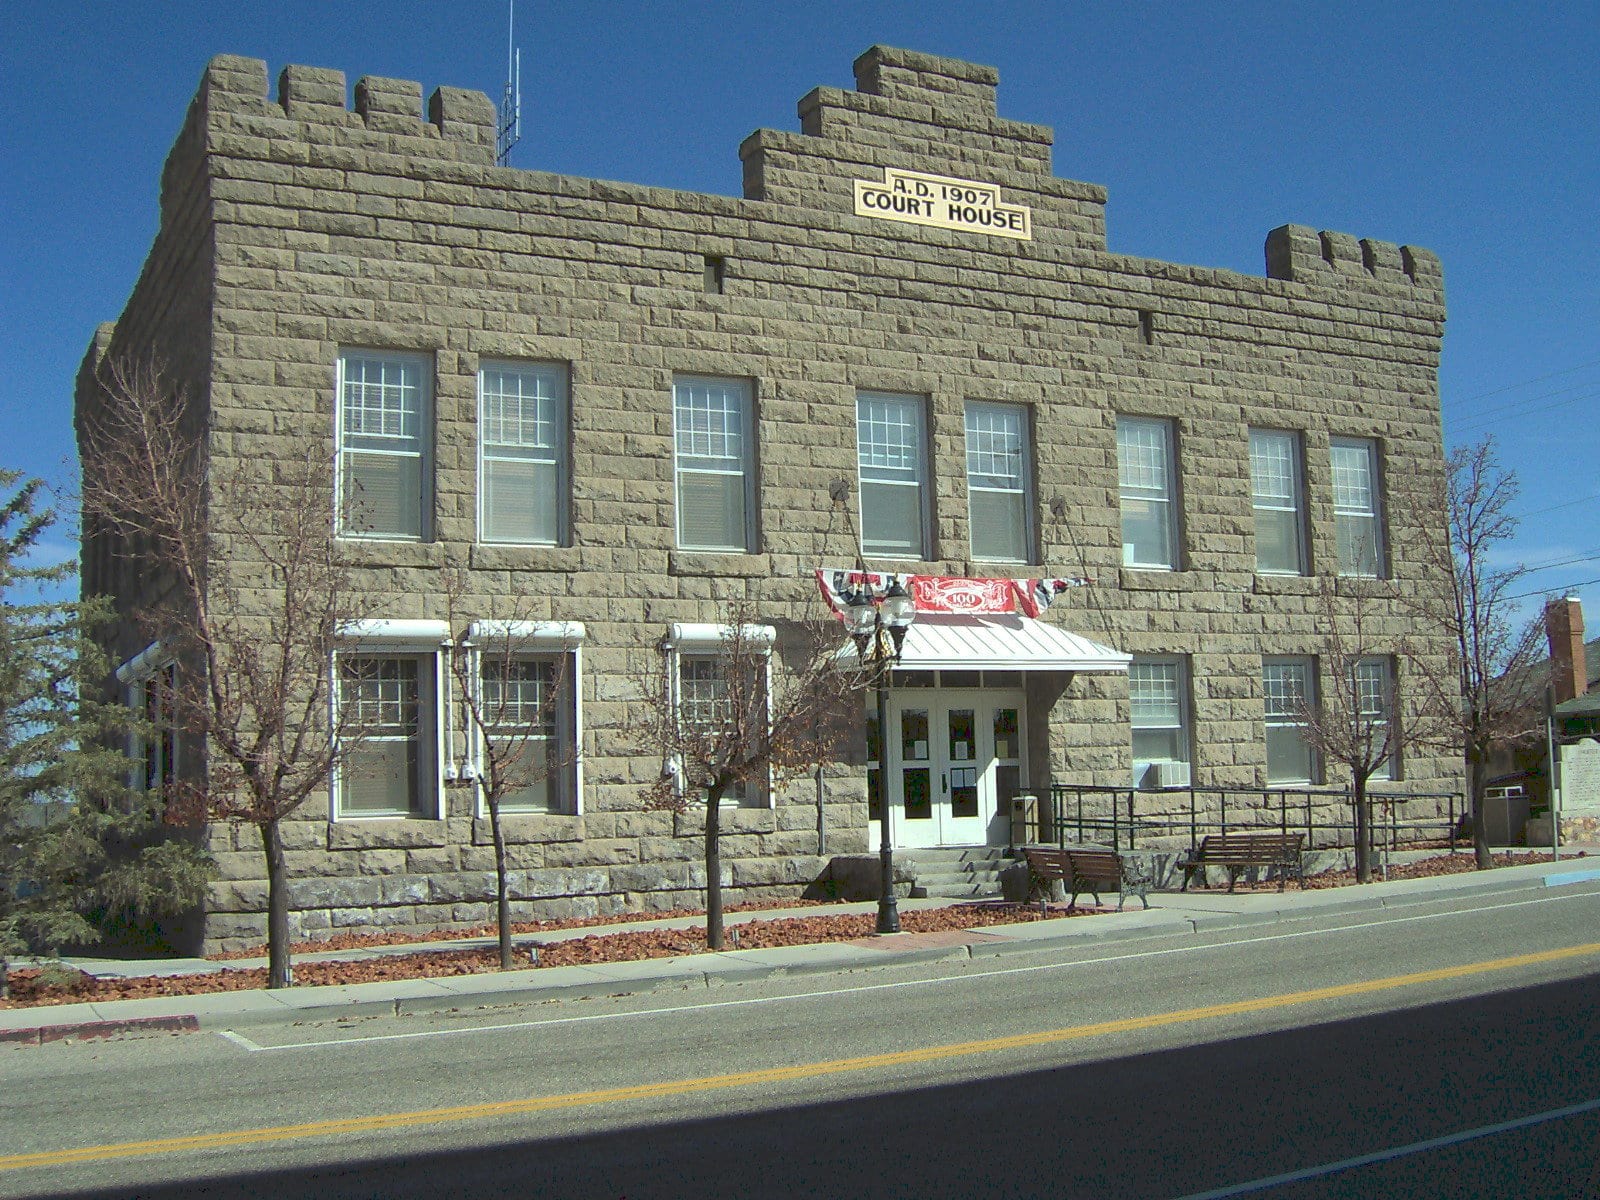
With fewer than a thousand residents spread across 3,500 square miles of high desert, Esmeralda regularly posts some of the most lopsided presidential margins in the American West, reflecting the political tendencies common to remote, rural mining counties.
Esmeralda County has leaned Republican in recent presidential elections, reaching a Democratic margin of seventy points in 1896. Between 2020 and 2024 the county moved one point toward the Democratic candidate; the 2024 margin was sixty-six points.
Its demographics describe the shift: a 71% non-Hispanic-white share, a median household income of $41,715, and a population of 1,028. The county's voting pattern over the last decade is most similar to that of Lincoln County and Stone County.
Compare two places, side by side
Twelve curated comparisons line up election history, demographics, and the divergence story for two places at a glance. Browse all comparisons →
Esmeralda County, Nevada. Akashic. https://akashic.app/county/32009/. Accessed May 20, 2026. License: CC BY 4.0.