Essex County, New Jersey: New American county. In 2024, voted D+45%. Democratic peak: D+57 in 2016.
Key facts
- 2024 presidential margin
- D+45MIT Election Lab
- Political typology
- New AmericanAkashic typology
- Population
- 863,0022024 5-year
- Median household income
- $80,7892024 5-year
- White (non-Hispanic)
- 30.0%2024 5-year
- Black
- 36.2%2024 5-year
- Hispanic / Latino
- 25.2%2024 5-year
- Peak Democratic margin
- D+57 in 2012MIT Election Lab
- Peak Republican margin
- R+46 in 1920MIT Election Lab
- Most similar
- Cook County, IL · similarity 1.00
| Kamala Harris ✓Democratic | 71.7% | 224,596 |
|---|---|---|
| Donald TrumpRepublican | 26.8% | 83,908 |
| OtherAll other candidates | 1.5% | 4,779 |
| Year | Margin (D minus R) |
|---|---|
| 1876 | No data |
| 1880 | No data |
| 1884 | No data |
| 1888 | No data |
| 1892 | +1.9% |
| 1896 | −33.7% |
| 1900 | −26.7% |
| 1904 | −31.4% |
| 1908 | −27.0% |
| 1912 | +11.5% |
| 1916 | −21.4% |
| 1920 | −45.9% |
| 1924 | −43.9% |
| 1928 | −17.5% |
| 1932 | −5.8% |
| 1936 | +10.6% |
| 1940 | −8.1% |
| 1944 | −1.3% |
| 1948 | −3.3% |
| 1952 | −9.7% |
| 1956 | −22.8% |
| 1960 | +12.7% |
| 1964 | +40.6% |
| 1968 | +12.7% |
| 1972 | −2.6% |
| 1976 | +12.8% |
| 1980 | +9.8% |
| 1984 | +11.6% |
| 1988 | +16.1% |
| 1992 | +24.9% |
| 1996 | +43.4% |
| 2000 | +45.7% |
| 2004 | +41.6% |
| 2008 | +52.6% |
| 2012 | +56.7% |
| 2016 | +56.8% |
| 2020 | +55.7% |
| 2024 | +44.9% |
| Year | Won | Margin | Democratic | Republican | Total |
|---|---|---|---|---|---|
| D | 224,596 | 83,908 | 313,283 | ||
| D | 266,820 | 75,475 | 343,591 | ||
| D | 240,837 | 63,176 | 312,884 | ||
| D | 237,035 | 64,767 | 304,071 | ||
| D | 240,306 | 74,063 | 316,183 | ||
| D | 203,681 | 83,374 | 289,348 | ||
| D | 185,505 | 66,842 | 259,573 | ||
| D | 175,368 | 65,162 | 254,196 | ||
| D | 158,130 | 89,146 | 276,858 | ||
| D | 156,098 | 111,491 | 276,967 | ||
| D | 173,295 | 136,798 | 314,543 | ||
| D | 145,281 | 117,222 | 287,166 | ||
| D | 174,434 | 133,911 | 315,812 | ||
| R | 161,270 | 170,036 | 338,888 | ||
| D | 185,440 | 140,084 | 357,095 | ||
| D | 277,042 | 116,172 | 396,477 | ||
| D | 217,878 | 167,848 | 393,623 | ||
| R | 146,313 | 234,682 | 388,253 | ||
| R | 180,501 | 219,863 | 407,635 | ||
| R | 155,468 | 166,963 | 343,567 | ||
| R | 174,320 | 178,989 | 360,742 | ||
| R | 154,363 | 182,124 | 344,034 | ||
| D | 174,857 | 140,991 | 319,441 | ||
| R | 132,666 | 149,630 | 290,772 | ||
| R | 118,268 | 168,856 | 288,514 | ||
| R | 41,708 | 123,614 | 186,673 | ||
| R | 40,970 | 116,168 | 163,848 | ||
| R | 34,596 | 54,167 | 91,439 | ||
| O | 26,250 | 16,994 | 80,601 | ||
| R | 30,191 | 53,687 | 87,004 | ||
| R | 25,452 | 50,508 | 79,863 | ||
| R | 25,735 | 45,318 | 73,294 | ||
| R | 20,509 | 42,587 | 65,525 | ||
| D | 30,176 | 29,044 | 60,324 | ||
| — | — | — | — | ||
| — | — | — | — | ||
| — | — | — | — | ||
| — | — | — | — |
Demographics
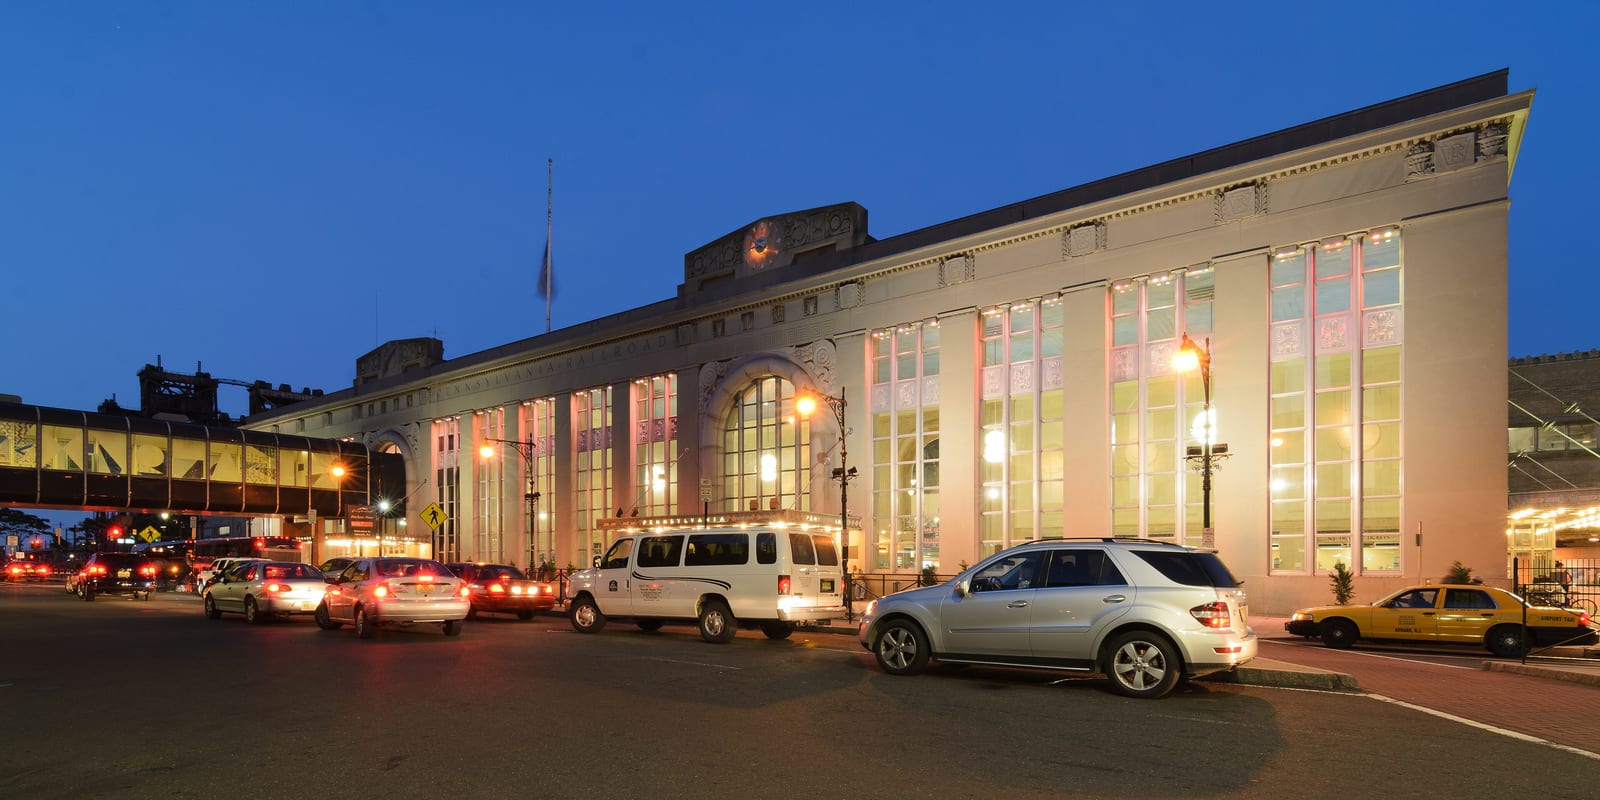
Essex County anchors New Jersey's urban core around Newark, delivering presidential margins above 40 points and a population density that makes it a reliable high-turnout anchor for statewide Democratic coalitions.
Essex County has leaned Democratic in recent presidential elections, reaching a Democratic margin of fifty-seven points in 2016. Between 2020 and 2024 it moved eleven points toward the Republican candidate — part of the sharpest rightward shift recorded among any group of places in the country.
Its demographics describe the shift: a 30% non-Hispanic-white share, a median household income of $80,789, and a population of 863,002. The county's voting pattern over the last decade is most similar to that of Cook County and Allendale County.
Compare two places, side by side
Twelve curated comparisons line up election history, demographics, and the divergence story for two places at a glance. Browse all comparisons →
Essex County, New Jersey. Akashic. https://akashic.app/county/34013/. Accessed May 20, 2026. License: CC BY 4.0.