Dawson County, Nebraska: New American county. In 2024, voted R+49%. Republican peak: R+64 in 1984.
Key facts
- 2024 presidential margin
- R+49MIT Election Lab
- Political typology
- New AmericanAkashic typology
- Population
- 24,2022024 5-year
- Median household income
- $69,8802024 5-year
- White (non-Hispanic)
- 59.2%2024 5-year
- Black
- 7.2%2024 5-year
- Hispanic / Latino
- 37.4%2024 5-year
- Peak Democratic margin
- D+41 in 1892MIT Election Lab
- Peak Republican margin
- R+64 in 1984MIT Election Lab
- Most similar
- Canyon County, ID · similarity 1.00
| Donald Trump ✓Republican | 74.1% | 6,312 |
|---|---|---|
| Kamala HarrisDemocratic | 24.7% | 2,101 |
| OtherAll other candidates | 1.3% | 109 |
| Year | Margin (D minus R) |
|---|---|
| 1876 | No data |
| 1880 | No data |
| 1884 | No data |
| 1888 | No data |
| 1892 | +40.8% |
| 1896 | +9.0% |
| 1900 | +4.3% |
| 1904 | −45.1% |
| 1908 | +5.0% |
| 1912 | +34.3% |
| 1916 | +15.4% |
| 1920 | −37.8% |
| 1924 | −25.0% |
| 1928 | −49.4% |
| 1932 | +22.0% |
| 1936 | +5.8% |
| 1940 | −32.0% |
| 1944 | −37.7% |
| 1948 | −23.5% |
| 1952 | −59.3% |
| 1956 | −52.3% |
| 1960 | −46.1% |
| 1964 | −9.4% |
| 1968 | −49.7% |
| 1972 | −62.7% |
| 1976 | −37.8% |
| 1980 | −60.7% |
| 1984 | −64.2% |
| 1988 | −43.1% |
| 1992 | −33.8% |
| 1996 | −32.4% |
| 2000 | −50.2% |
| 2004 | −55.6% |
| 2008 | −38.3% |
| 2012 | −41.5% |
| 2016 | −44.6% |
| 2020 | −43.8% |
| 2024 | −49.4% |
| Year | Won | Margin | Democratic | Republican | Total |
|---|---|---|---|---|---|
| R | 2,101 | 6,312 | 8,522 | ||
| R | 2,497 | 6,524 | 9,191 | ||
| R | 2,136 | 5,984 | 8,635 | ||
| R | 2,199 | 5,460 | 7,859 | ||
| R | 2,399 | 5,460 | 7,986 | ||
| R | 1,728 | 6,149 | 7,956 | ||
| R | 1,740 | 5,511 | 7,507 | ||
| R | 2,180 | 4,794 | 8,065 | ||
| R | 1,741 | 4,714 | 8,789 | ||
| R | 2,184 | 5,529 | 7,755 | ||
| R | 1,487 | 6,887 | 8,407 | ||
| R | 1,463 | 6,689 | 8,609 | ||
| R | 2,395 | 5,413 | 7,985 | ||
| R | 1,424 | 6,211 | 7,635 | ||
| R | 1,614 | 5,221 | 7,254 | ||
| R | 3,790 | 4,577 | 8,367 | ||
| R | 2,388 | 6,480 | 8,868 | ||
| R | 2,039 | 6,503 | 8,542 | ||
| R | 1,820 | 7,130 | 8,950 | ||
| R | 2,603 | 4,203 | 6,806 | ||
| R | 2,270 | 5,017 | 7,287 | ||
| R | 2,803 | 5,445 | 8,248 | ||
| D | 4,021 | 3,573 | 7,702 | ||
| D | 4,513 | 2,859 | 7,505 | ||
| R | 1,718 | 5,125 | 6,902 | ||
| R | 1,526 | 3,016 | 5,952 | ||
| R | 1,444 | 3,384 | 5,128 | ||
| D | 1,989 | 1,444 | 3,544 | ||
| D | 1,613 | 449 | 3,397 | ||
| D | 1,926 | 1,737 | 3,772 | ||
| R | 457 | 1,712 | 2,783 | ||
| D | 1,399 | 1,280 | 2,761 | ||
| D | 1,357 | 1,128 | 2,547 | ||
| D | 1,188 | 182 | 2,463 | ||
| — | — | — | — | ||
| — | — | — | — | ||
| — | — | — | — | ||
| — | — | — | — |
Demographics
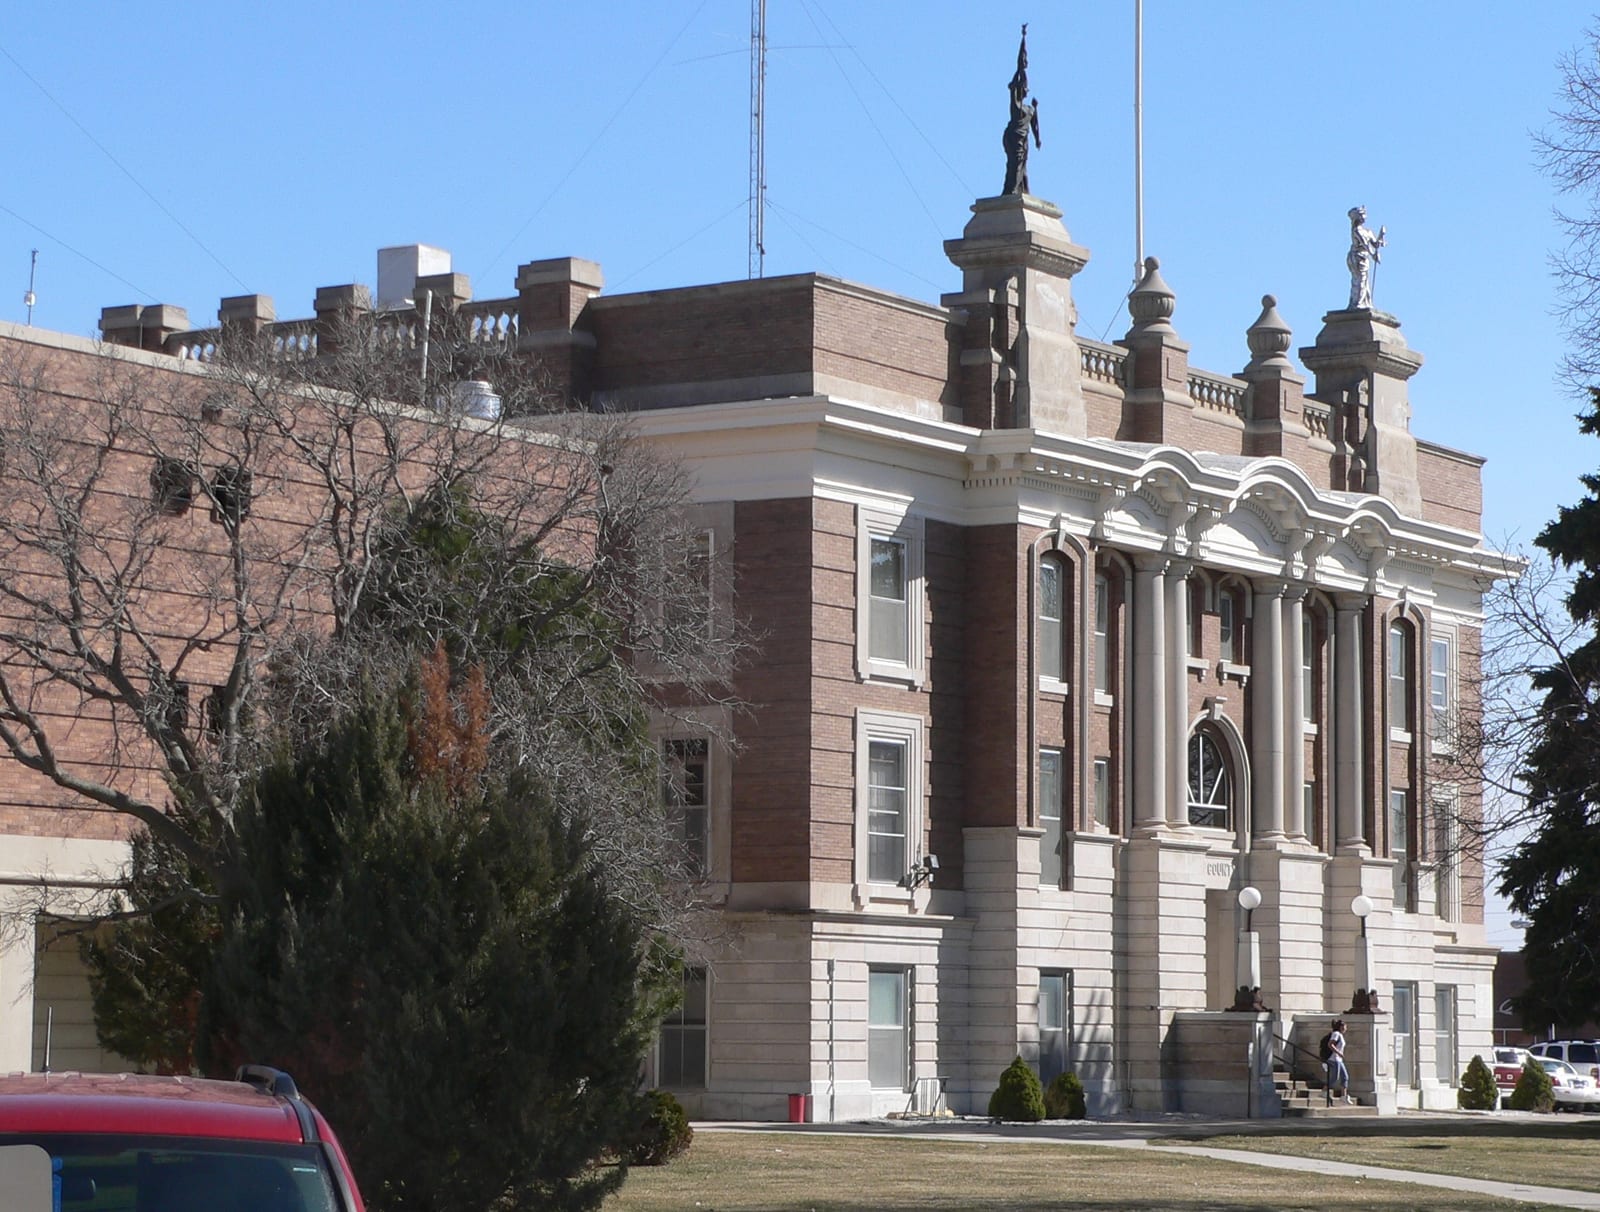
Dawson County, anchored by Lexington along the Platte River, recorded an R+49.6 presidential margin in 2024. Its meatpacking economy draws a sizable Latino workforce, yet countywide results remain among the state's most Republican.
Dawson County has leaned Republican in recent presidential elections, reaching a Democratic margin of forty-one points in 1892. Between 2020 and 2024 it moved six points toward the Republican candidate — part of the sharpest rightward shift recorded among any group of places in the country.
Its demographics describe the shift: a 59% non-Hispanic-white share, a median household income of $69,880, and a population of 24,202. The county's voting pattern over the last decade is most similar to that of Canyon County and Buffalo County.
Compare two places, side by side
Twelve curated comparisons line up election history, demographics, and the divergence story for two places at a glance. Browse all comparisons →
Dawson County, Nebraska. Akashic. https://akashic.app/county/31047/. Accessed May 20, 2026. License: CC BY 4.0.