Grand Forks County, North Dakota: Industrial Catholic Metro county. In 2024, voted R+18%. Republican peak: R+54 in 1924.
Key facts
- 2024 presidential margin
- R+18MIT Election Lab
- Political typology
- Industrial Catholic MetroAkashic typology
- Population
- 72,9232024 5-year
- Median household income
- $68,0752024 5-year
- White (non-Hispanic)
- 83.1%2024 5-year
- Black
- 3.9%2024 5-year
- Hispanic / Latino
- 5.4%2024 5-year
- Peak Democratic margin
- D+34 in 1936MIT Election Lab
- Peak Republican margin
- R+54 in 1924MIT Election Lab
- Most similar
- Traill County, ND · similarity 0.98
| Donald Trump ✓Republican | 57.7% | 18,123 |
|---|---|---|
| Kamala HarrisDemocratic | 39.7% | 12,469 |
| OtherAll other candidates | 2.6% | 819 |
| Year | Margin (D minus R) |
|---|---|
| 1876 | No data |
| 1880 | No data |
| 1884 | No data |
| 1888 | No data |
| 1892 | −51.3% |
| 1896 | −12.3% |
| 1900 | −25.2% |
| 1904 | −51.6% |
| 1908 | −20.7% |
| 1912 | +13.4% |
| 1916 | +12.7% |
| 1920 | −49.5% |
| 1924 | −54.0% |
| 1928 | −30.1% |
| 1932 | +19.3% |
| 1936 | +33.7% |
| 1940 | +8.7% |
| 1944 | +15.2% |
| 1948 | +4.5% |
| 1952 | −31.8% |
| 1956 | −24.5% |
| 1960 | −13.7% |
| 1964 | +18.6% |
| 1968 | −11.2% |
| 1972 | −16.8% |
| 1976 | −8.7% |
| 1980 | −29.4% |
| 1984 | −22.3% |
| 1988 | −8.4% |
| 1992 | −8.9% |
| 1996 | −0.9% |
| 2000 | −18.6% |
| 2004 | −15.3% |
| 2008 | +5.1% |
| 2012 | −3.4% |
| 2016 | −18.1% |
| 2020 | −13.3% |
| 2024 | −18.0% |
| Year | Won | Margin | Democratic | Republican | Total |
|---|---|---|---|---|---|
| R | 12,469 | 18,123 | 31,411 | ||
| R | 12,880 | 16,987 | 30,970 | ||
| R | 10,851 | 16,340 | 30,365 | ||
| R | 14,032 | 15,060 | 30,029 | ||
| D | 16,104 | 14,520 | 31,153 | ||
| R | 12,646 | 17,298 | 30,470 | ||
| R | 10,593 | 15,875 | 28,385 | ||
| R | 11,376 | 11,606 | 25,836 | ||
| R | 10,930 | 13,705 | 31,104 | ||
| R | 12,494 | 14,801 | 27,531 | ||
| R | 10,050 | 15,898 | 26,191 | ||
| R | 6,997 | 14,257 | 24,731 | ||
| R | 11,545 | 13,820 | 26,218 | ||
| R | 9,416 | 13,361 | 23,475 | ||
| R | 7,695 | 9,802 | 18,849 | ||
| D | 10,740 | 7,367 | 18,175 | ||
| R | 8,341 | 10,997 | 19,343 | ||
| R | 6,231 | 10,289 | 16,550 | ||
| R | 5,639 | 10,939 | 16,662 | ||
| D | 6,996 | 6,374 | 13,789 | ||
| D | 7,707 | 5,668 | 13,434 | ||
| D | 8,396 | 7,043 | 15,506 | ||
| D | 9,222 | 4,312 | 14,549 | ||
| D | 7,579 | 5,090 | 12,900 | ||
| R | 4,300 | 8,024 | 12,371 | ||
| R | 943 | 6,690 | 10,651 | ||
| R | 2,527 | 7,646 | 10,332 | ||
| D | 2,814 | 2,159 | 5,148 | ||
| O | 1,492 | 955 | 3,999 | ||
| R | 1,750 | 2,740 | 4,773 | ||
| R | 828 | 2,807 | 3,837 | ||
| R | 1,532 | 2,603 | 4,244 | ||
| R | 1,893 | 2,432 | 4,365 | ||
| R | 0 | 1,639 | 3,197 | ||
| — | — | — | — | ||
| — | — | — | — | ||
| — | — | — | — | ||
| — | — | — | — |
Demographics
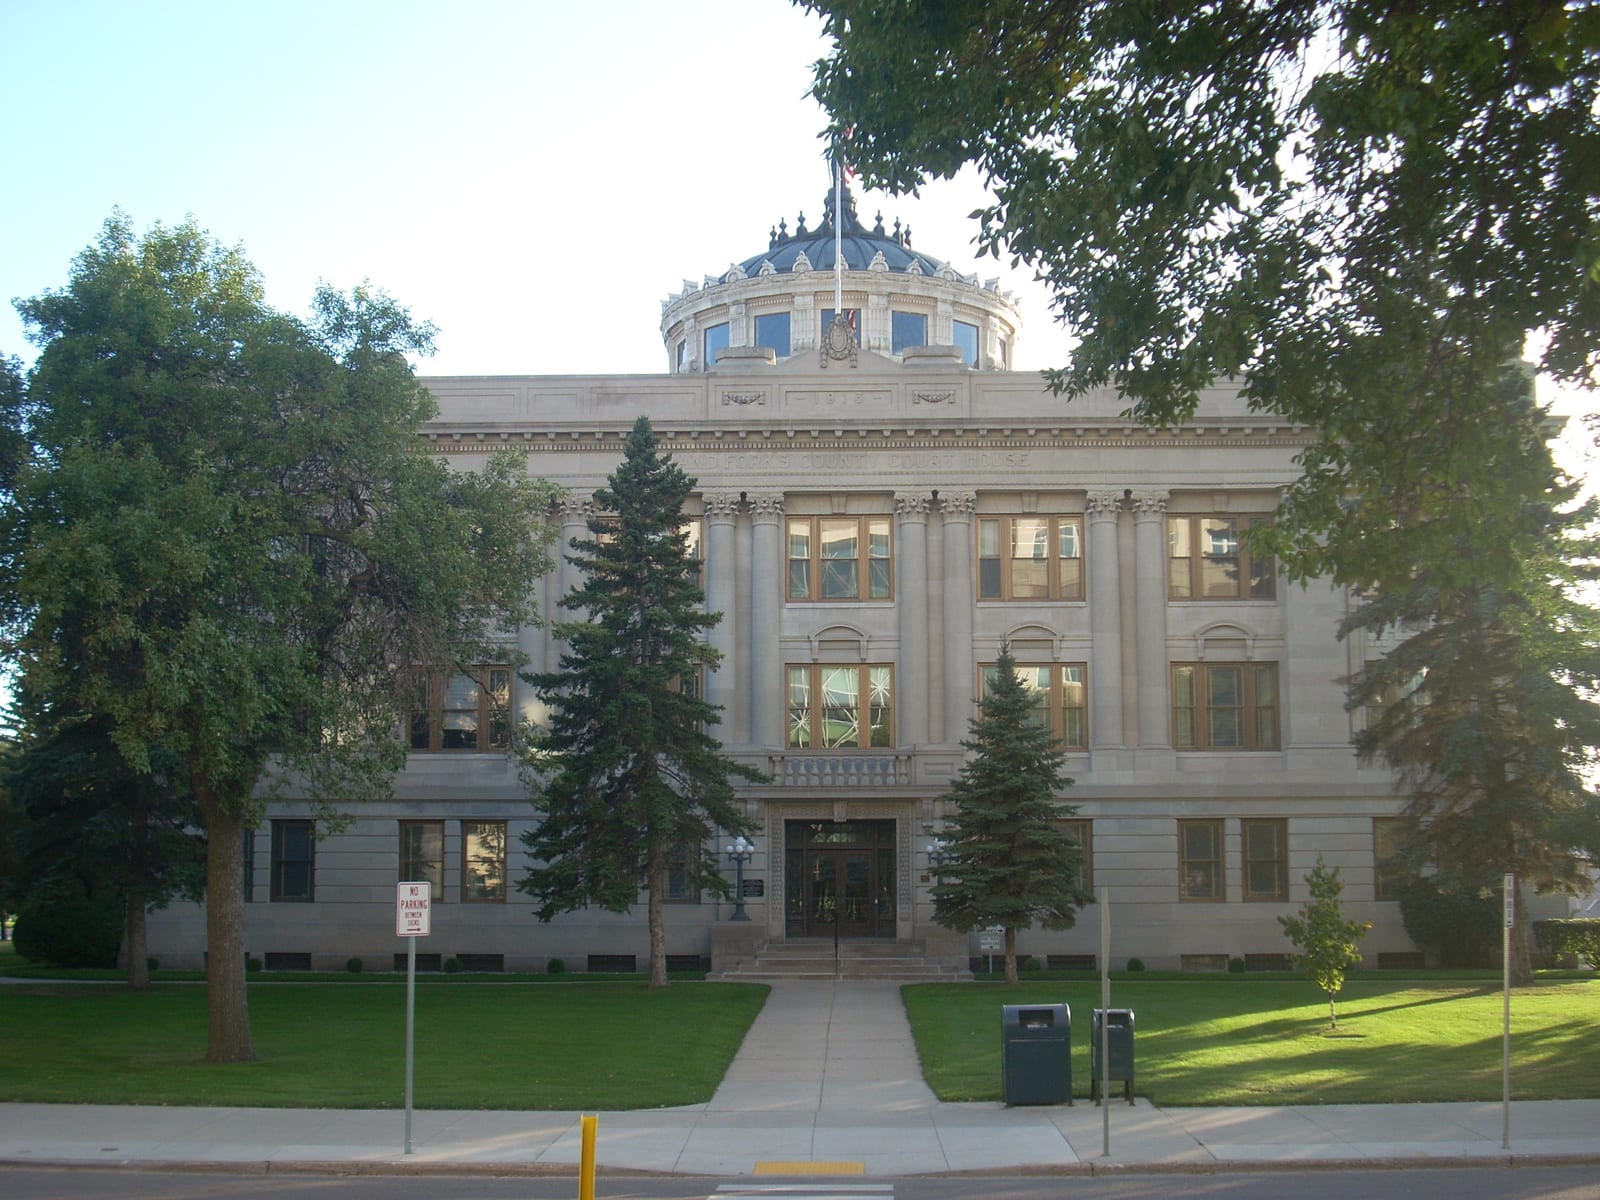
Grand Forks County anchors a regional university economy in the Red River Valley but has trended decisively Republican in recent cycles, posting an R+18 margin in 2024 despite a sizable student and academic population.
Its margins are typically close. The Democratic margin reached thirty-four points in 1936; the Republican margin reached fifty-four points in 1924. Between 2020 and 2024 the county moved five points toward the Republican candidate; the 2024 margin was eighteen points.
Its demographics sit near national norms: a 83% non-Hispanic-white share, a median household income of $68,075, and a 13% poverty rate. The county's voting pattern over the last decade is most similar to that of Traill County and Richland County.
Compare two places, side by side
Twelve curated comparisons line up election history, demographics, and the divergence story for two places at a glance. Browse all comparisons →
Grand Forks County, North Dakota. Akashic. https://akashic.app/county/38035/. Accessed May 20, 2026. License: CC BY 4.0.