Kay County, Oklahoma: Stable Rural Right county. In 2024, voted R+49%. Republican peak: R+59 in 1972.
Key facts
- 2024 presidential margin
- R+49MIT Election Lab
- Political typology
- Stable Rural RightAkashic typology
- Population
- 43,6252024 5-year
- Median household income
- $58,4232024 5-year
- White (non-Hispanic)
- 74.1%2024 5-year
- Black
- 2.0%2024 5-year
- Hispanic / Latino
- 9.0%2024 5-year
- Peak Democratic margin
- D+37 in 1932MIT Election Lab
- Peak Republican margin
- R+59 in 1972MIT Election Lab
- Most similar
- Rusk County, TX · similarity 1.00
| Donald Trump ✓Republican | 73.8% | 12,483 |
|---|---|---|
| Kamala HarrisDemocratic | 24.5% | 4,136 |
| OtherAll other candidates | 1.7% | 294 |
| Year | Margin (D minus R) |
|---|---|
| 1876 | No data |
| 1880 | No data |
| 1884 | No data |
| 1888 | No data |
| 1892 | No data |
| 1896 | No data |
| 1900 | No data |
| 1904 | No data |
| 1908 | −4.5% |
| 1912 | −2.4% |
| 1916 | −2.7% |
| 1920 | −13.2% |
| 1924 | −9.3% |
| 1928 | −53.0% |
| 1932 | +37.2% |
| 1936 | +27.7% |
| 1940 | +3.5% |
| 1944 | −4.6% |
| 1948 | +6.0% |
| 1952 | −32.5% |
| 1956 | −29.5% |
| 1960 | −29.5% |
| 1964 | −3.2% |
| 1968 | −31.1% |
| 1972 | −59.1% |
| 1976 | −13.9% |
| 1980 | −38.3% |
| 1984 | −46.6% |
| 1988 | −23.8% |
| 1992 | −10.8% |
| 1996 | −14.7% |
| 2000 | −31.1% |
| 2004 | −40.7% |
| 2008 | −41.6% |
| 2012 | −42.6% |
| 2016 | −50.2% |
| 2020 | −51.0% |
| 2024 | −49.4% |
| Year | Won | Margin | Democratic | Republican | Total |
|---|---|---|---|---|---|
| R | 4,136 | 12,483 | 16,913 | ||
| R | 4,040 | 12,834 | 17,249 | ||
| R | 3,738 | 12,172 | 16,803 | ||
| R | 4,627 | 11,499 | 16,126 | ||
| R | 5,463 | 13,230 | 18,693 | ||
| R | 5,957 | 14,121 | 20,078 | ||
| R | 6,122 | 11,768 | 18,162 | ||
| R | 6,882 | 9,741 | 19,514 | ||
| R | 6,643 | 9,115 | 22,828 | ||
| R | 7,751 | 12,646 | 20,564 | ||
| R | 6,044 | 16,731 | 22,911 | ||
| R | 6,449 | 15,004 | 22,337 | ||
| R | 9,371 | 12,441 | 22,086 | ||
| R | 4,246 | 17,244 | 21,984 | ||
| R | 6,031 | 12,751 | 21,591 | ||
| R | 11,296 | 12,033 | 23,329 | ||
| R | 8,249 | 15,156 | 23,405 | ||
| R | 8,071 | 14,837 | 22,908 | ||
| R | 8,382 | 16,460 | 24,842 | ||
| D | 10,119 | 8,982 | 19,101 | ||
| R | 8,656 | 9,498 | 18,242 | ||
| D | 10,725 | 10,003 | 20,884 | ||
| D | 11,846 | 6,671 | 18,649 | ||
| D | 12,841 | 5,884 | 18,725 | ||
| R | 4,196 | 13,829 | 18,161 | ||
| R | 6,049 | 7,392 | 14,448 | ||
| R | 4,546 | 5,959 | 10,736 | ||
| R | 2,340 | 2,482 | 5,318 | ||
| R | 2,380 | 2,508 | 5,267 | ||
| R | 2,511 | 2,754 | 5,410 | ||
| — | — | — | — | ||
| — | — | — | — | ||
| — | — | — | — | ||
| — | — | — | — | ||
| — | — | — | — | ||
| — | — | — | — | ||
| — | — | — | — | ||
| — | — | — | — |
Demographics
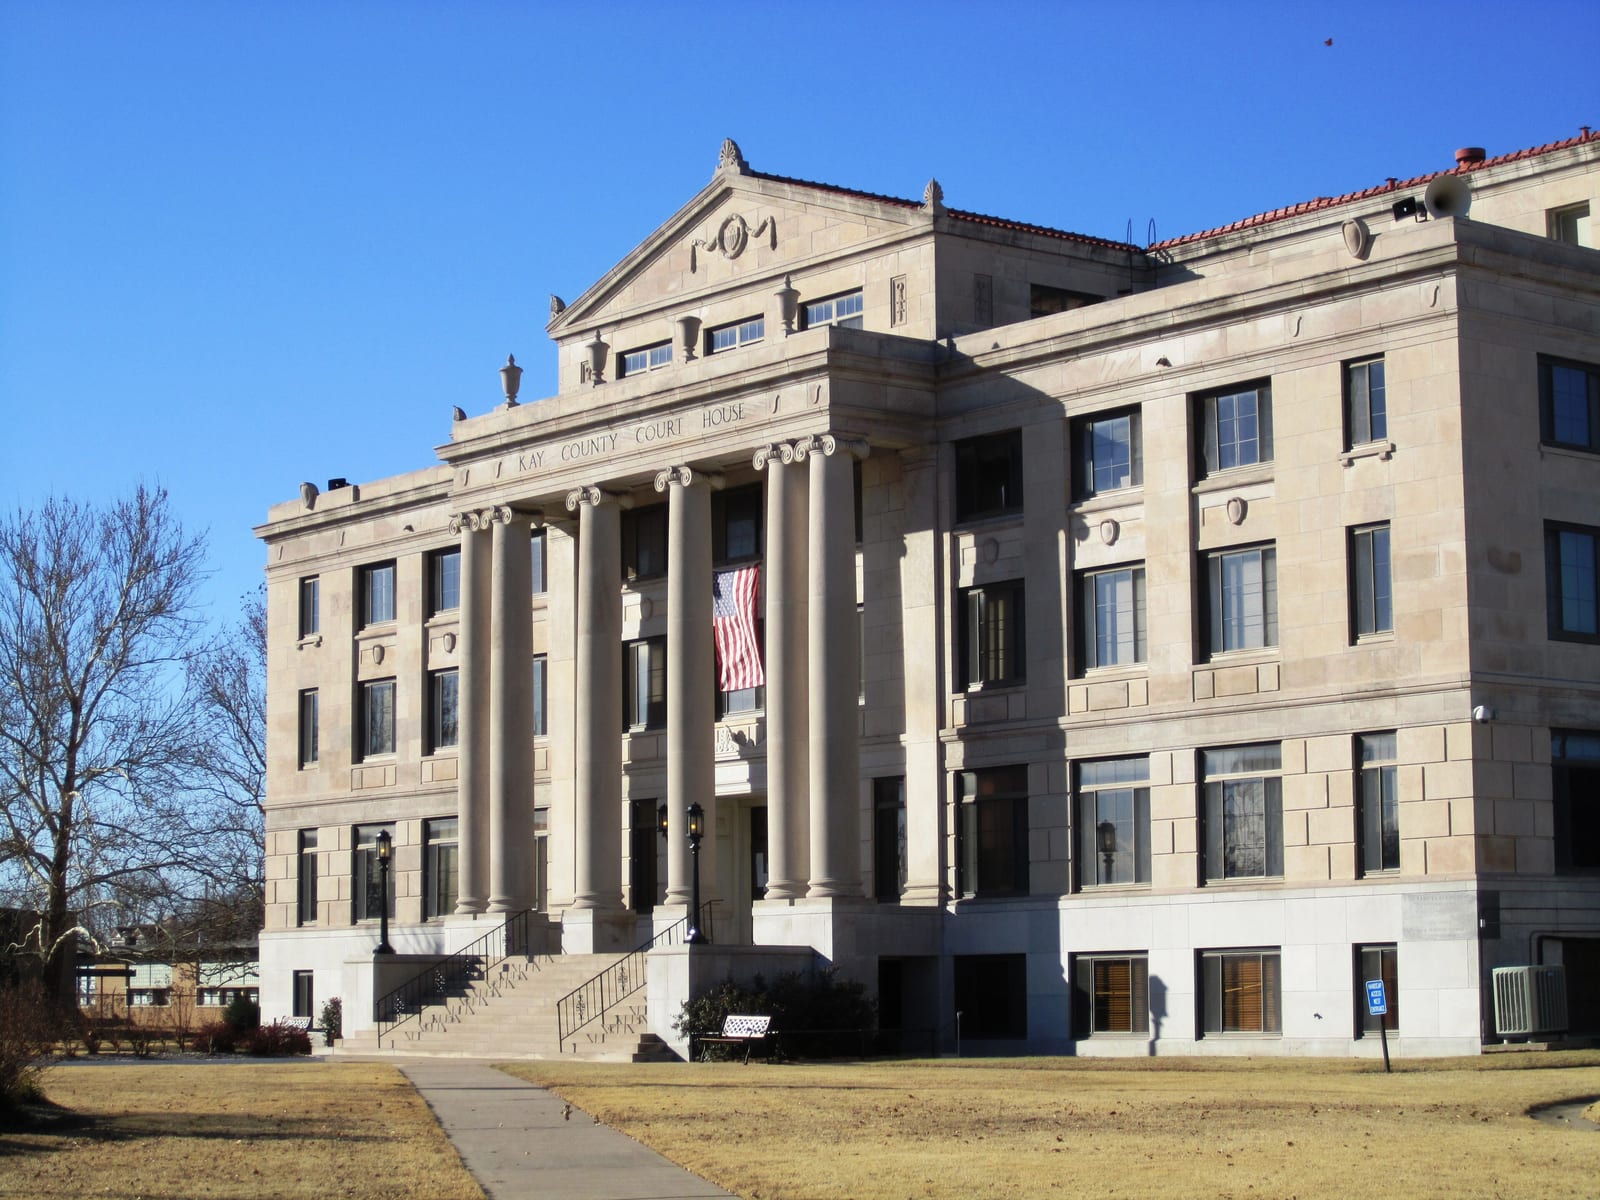
Kay County, anchored by Ponca City and its oil-industry roots, has delivered Republican presidential margins above 40 points in recent cycles, reflecting a rural, energy-sector workforce that tilts heavily toward the GOP.
The Republican margin here reached fifty-nine points in 1972. Between 2020 and 2024 the county moved two points toward the Democratic candidate; the 2024 margin was forty-nine points.
A population of 43,625, a 74% non-Hispanic-white share, and a median household income of $58,423 describe the county. The county's voting pattern over the last decade is most similar to that of Rusk County and Geneva County.
Compare two places, side by side
Twelve curated comparisons line up election history, demographics, and the divergence story for two places at a glance. Browse all comparisons →
Kay County, Oklahoma. Akashic. https://akashic.app/county/40071/. Accessed May 20, 2026. License: CC BY 4.0.