Kiowa County, Oklahoma: Evangelical Deep South county. In 2024, voted R+58%. Democratic peak: D+69 in 1932.
Key facts
- 2024 presidential margin
- R+58MIT Election Lab
- Political typology
- Evangelical Deep SouthAkashic typology
- Population
- 8,3832024 5-year
- Median household income
- $44,9622024 5-year
- White (non-Hispanic)
- 79.1%2024 5-year
- Black
- 3.6%2024 5-year
- Hispanic / Latino
- 12.2%2024 5-year
- Peak Democratic margin
- D+69 in 1932MIT Election Lab
- Peak Republican margin
- R+58 in 2020MIT Election Lab
- Most similar
- Shelby County, MO · similarity 1.00
| Donald Trump ✓Republican | 78.4% | 2,569 |
|---|---|---|
| Kamala HarrisDemocratic | 20.1% | 658 |
| OtherAll other candidates | 1.6% | 51 |
| Year | Margin (D minus R) |
|---|---|
| 1876 | No data |
| 1880 | No data |
| 1884 | No data |
| 1888 | No data |
| 1892 | No data |
| 1896 | No data |
| 1900 | No data |
| 1904 | No data |
| 1908 | +17.9% |
| 1912 | +16.8% |
| 1916 | +28.5% |
| 1920 | −2.3% |
| 1924 | +19.5% |
| 1928 | −28.5% |
| 1932 | +68.7% |
| 1936 | +53.5% |
| 1940 | +29.5% |
| 1944 | +33.3% |
| 1948 | +47.2% |
| 1952 | −8.1% |
| 1956 | +10.8% |
| 1960 | −14.3% |
| 1964 | +25.1% |
| 1968 | −3.6% |
| 1972 | −41.7% |
| 1976 | +26.4% |
| 1980 | −5.2% |
| 1984 | −18.7% |
| 1988 | +6.1% |
| 1992 | +10.3% |
| 1996 | +8.1% |
| 2000 | −16.8% |
| 2004 | −29.8% |
| 2008 | −34.8% |
| 2012 | −35.4% |
| 2016 | −52.4% |
| 2020 | −57.6% |
| 2024 | −58.3% |
| Year | Won | Margin | Democratic | Republican | Total |
|---|---|---|---|---|---|
| R | 658 | 2,569 | 3,278 | ||
| R | 699 | 2,673 | 3,427 | ||
| R | 767 | 2,596 | 3,493 | ||
| R | 1,106 | 2,316 | 3,422 | ||
| R | 1,226 | 2,537 | 3,763 | ||
| R | 1,413 | 2,610 | 4,023 | ||
| R | 1,544 | 2,173 | 3,750 | ||
| D | 1,973 | 1,638 | 4,128 | ||
| D | 2,143 | 1,635 | 4,910 | ||
| D | 2,296 | 2,030 | 4,358 | ||
| R | 2,016 | 2,951 | 4,995 | ||
| R | 2,372 | 2,636 | 5,124 | ||
| D | 3,403 | 1,971 | 5,420 | ||
| R | 1,495 | 3,711 | 5,316 | ||
| R | 2,219 | 2,418 | 5,594 | ||
| D | 3,686 | 2,206 | 5,892 | ||
| R | 2,638 | 3,515 | 6,153 | ||
| D | 3,371 | 2,713 | 6,084 | ||
| R | 3,489 | 4,100 | 7,589 | ||
| D | 4,263 | 1,530 | 5,793 | ||
| D | 4,175 | 2,081 | 6,280 | ||
| D | 4,679 | 2,539 | 7,252 | ||
| D | 5,624 | 1,684 | 7,361 | ||
| D | 5,204 | 966 | 6,170 | ||
| R | 2,270 | 4,116 | 6,478 | ||
| D | 2,635 | 1,688 | 4,854 | ||
| R | 2,518 | 2,649 | 5,610 | ||
| D | 2,279 | 1,017 | 4,426 | ||
| D | 1,831 | 1,167 | 3,949 | ||
| D | 2,354 | 1,591 | 4,265 | ||
| — | — | — | — | ||
| — | — | — | — | ||
| — | — | — | — | ||
| — | — | — | — | ||
| — | — | — | — | ||
| — | — | — | — | ||
| — | — | — | — | ||
| — | — | — | — |
Demographics
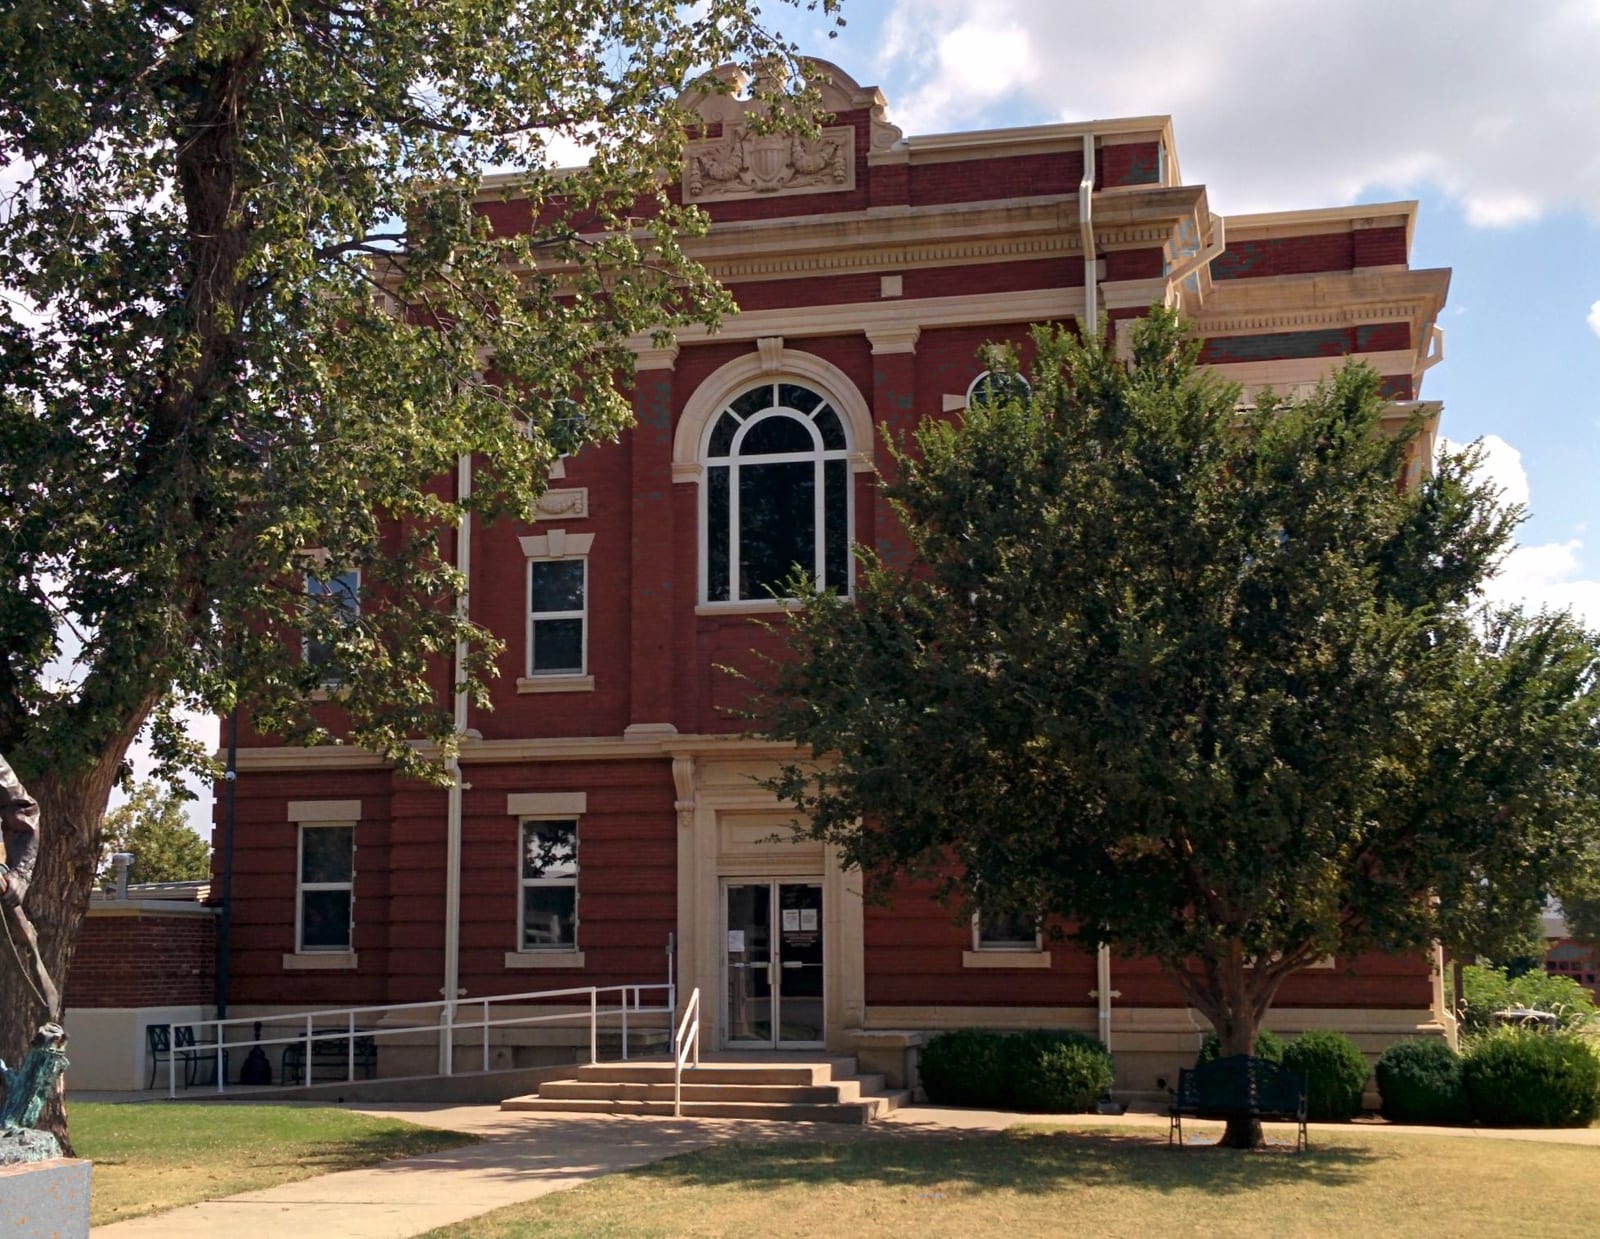
Kiowa County, anchored by the small city of Hobart, delivered a 58-point Republican presidential margin in 2024 — a spread typical of rural southwestern Oklahoma, where ranching and agriculture shape both the economy and the electorate.
The Republican margin here reached its widest at fifty-eight points in 2024. Between 2020 and 2024 the county moved one point toward the Republican candidate; the 2024 margin was fifty-eight points.
A median household income of $44,962, a 23% poverty rate, and a 79% non-Hispanic-white share describe the county. The county's voting pattern over the last decade is most similar to that of Shelby County and Cotton County.
Compare two places, side by side
Twelve curated comparisons line up election history, demographics, and the divergence story for two places at a glance. Browse all comparisons →
Kiowa County, Oklahoma. Akashic. https://akashic.app/county/40075/. Accessed May 20, 2026. License: CC BY 4.0.