Pickens County, South Carolina: Stable Rural Right county. In 2024, voted R+53%. Democratic peak: D+99 in 1904.
Key facts
- 2024 presidential margin
- R+53MIT Election Lab
- Political typology
- Stable Rural RightAkashic typology
- Population
- 134,6292024 5-year
- Median household income
- $61,0642024 5-year
- White (non-Hispanic)
- 84.2%2024 5-year
- Black
- 5.8%2024 5-year
- Hispanic / Latino
- 5.4%2024 5-year
- Peak Democratic margin
- D+99 in 1904MIT Election Lab
- Peak Republican margin
- R+67 in 1972MIT Election Lab
- Most similar
- Baldwin County, AL · similarity 1.00
| Donald Trump ✓Republican | 75.6% | 45,728 |
|---|---|---|
| Kamala HarrisDemocratic | 23.0% | 13,891 |
| OtherAll other candidates | 1.4% | 832 |
| Year | Margin (D minus R) |
|---|---|
| 1876 | No data |
| 1880 | No data |
| 1884 | No data |
| 1888 | No data |
| 1892 | +39.6% |
| 1896 | +76.2% |
| 1900 | +87.9% |
| 1904 | +98.7% |
| 1908 | +91.4% |
| 1912 | +96.1% |
| 1916 | +94.5% |
| 1920 | +87.6% |
| 1924 | +93.3% |
| 1928 | +70.5% |
| 1932 | +97.9% |
| 1936 | +98.2% |
| 1940 | +93.1% |
| 1944 | +58.8% |
| 1948 | +13.9% |
| 1952 | −3.9% |
| 1956 | +2.3% |
| 1960 | −24.5% |
| 1964 | −25.3% |
| 1968 | −36.5% |
| 1972 | −66.6% |
| 1976 | +2.9% |
| 1980 | −10.0% |
| 1984 | −54.0% |
| 1988 | −47.9% |
| 1992 | −29.6% |
| 1996 | −31.5% |
| 2000 | −45.6% |
| 2004 | −48.1% |
| 2008 | −46.2% |
| 2012 | −49.0% |
| 2016 | −52.8% |
| 2020 | −50.8% |
| 2024 | −52.7% |
| Year | Won | Margin | Democratic | Republican | Total |
|---|---|---|---|---|---|
| R | 13,891 | 45,728 | 60,451 | ||
| R | 13,645 | 42,907 | 57,546 | ||
| R | 10,354 | 36,236 | 49,049 | ||
| R | 11,156 | 33,474 | 45,549 | ||
| R | 11,691 | 32,552 | 45,128 | ||
| R | 10,287 | 29,759 | 40,510 | ||
| R | 8,927 | 24,681 | 34,582 | ||
| R | 8,369 | 17,151 | 27,900 | ||
| R | 8,275 | 17,008 | 29,494 | ||
| R | 6,103 | 17,448 | 23,696 | ||
| R | 4,481 | 15,155 | 19,764 | ||
| R | 7,789 | 9,575 | 17,923 | ||
| D | 8,505 | 8,029 | 16,655 | ||
| R | 2,255 | 11,776 | 14,296 | ||
| R | 2,016 | 6,873 | 13,313 | ||
| R | 3,506 | 5,882 | 9,391 | ||
| R | 2,546 | 4,201 | 6,747 | ||
| D | 1,847 | 1,747 | 4,278 | ||
| R | 2,865 | 3,096 | 5,961 | ||
| O | 435 | 165 | 1,944 | ||
| D | 1,662 | 211 | 2,468 | ||
| D | 2,122 | 76 | 2,198 | ||
| D | 2,678 | 0 | 2,728 | ||
| D | 2,685 | 0 | 2,742 | ||
| D | 1,110 | 192 | 1,302 | ||
| D | 1,044 | 35 | 1,082 | ||
| D | 955 | 63 | 1,018 | ||
| D | 1,139 | 7 | 1,198 | ||
| D | 815 | 0 | 848 | ||
| D | 1,241 | 56 | 1,297 | ||
| D | 914 | 6 | 920 | ||
| D | 933 | 60 | 993 | ||
| D | 1,261 | 170 | 1,431 | ||
| D | 603 | 129 | 1,196 | ||
| — | — | — | — | ||
| — | — | — | — | ||
| — | — | — | — | ||
| — | — | — | — |
Demographics
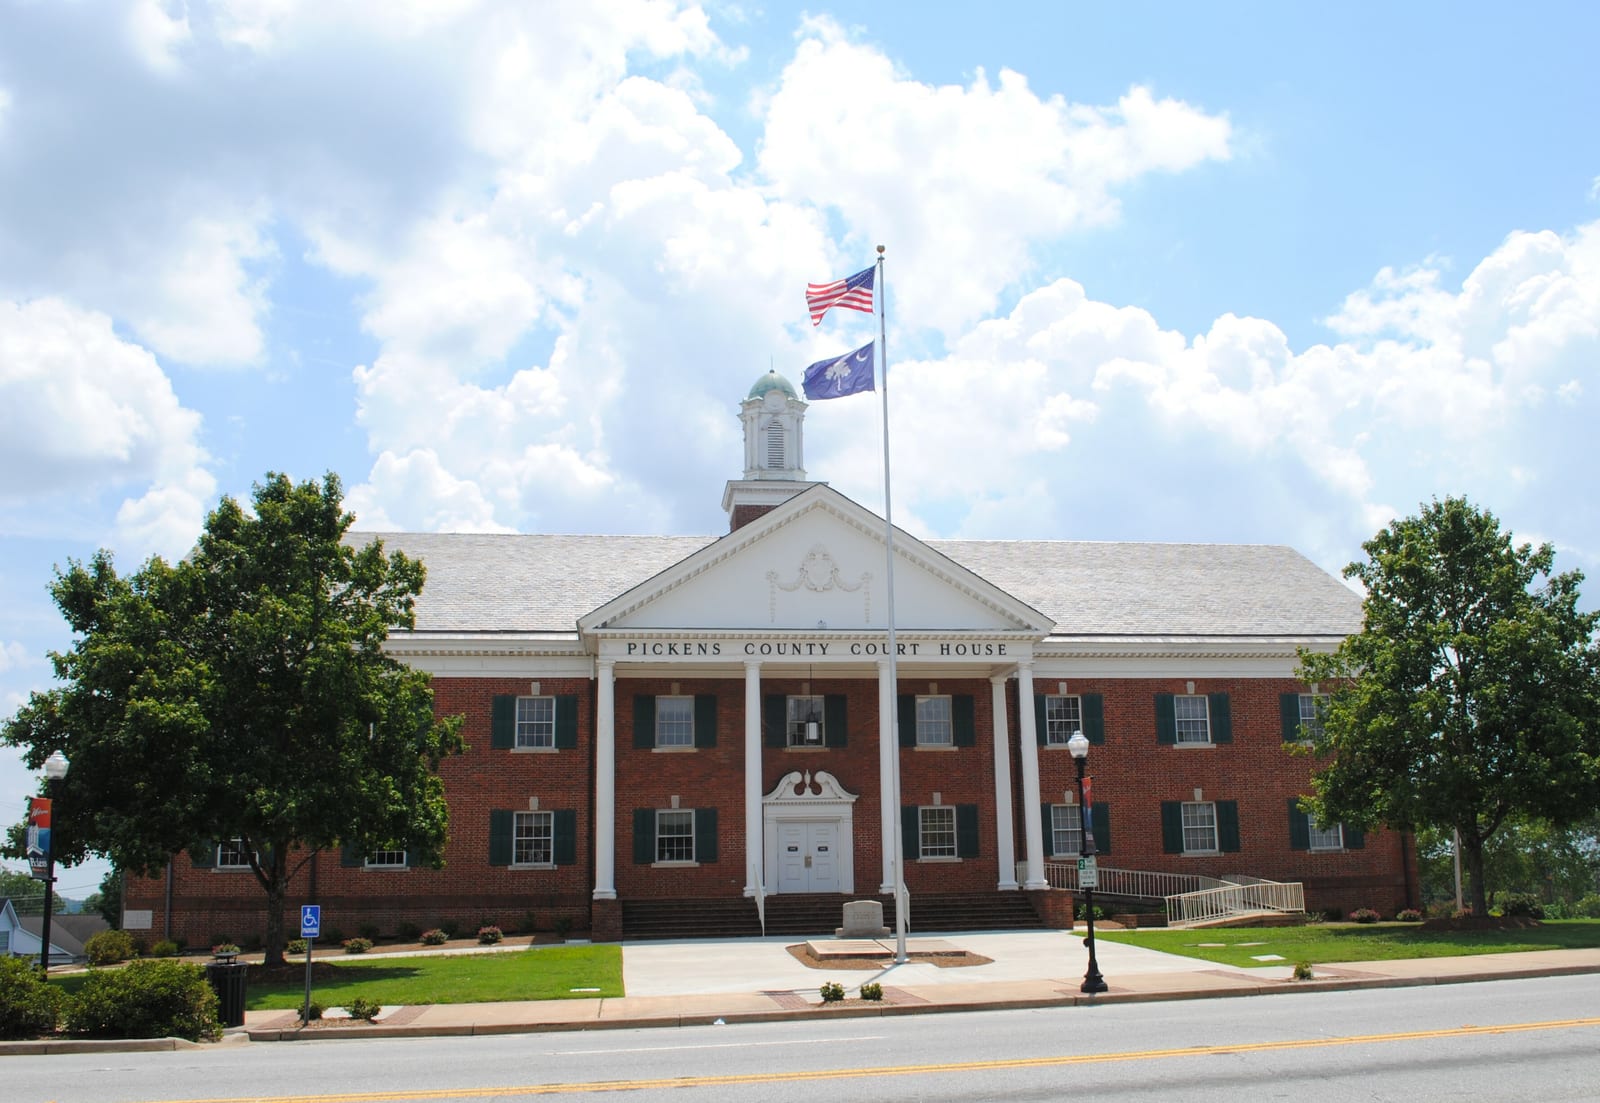
Pickens County sits in the Blue Ridge foothills and has delivered Republican presidential margins above 50 points in recent cycles, driven by a mix of rural townships and the college town of Clemson, whose university presence tempers but doesn't reverse the county's conservative lean.
The Republican margin here reached sixty-seven points in 1972. Between 2020 and 2024 the county moved two points toward the Republican candidate; the 2024 margin was fifty-three points.
A population of 134,629, a 84% non-Hispanic-white share, and a median household income of $61,064 describe the county. The county's voting pattern over the last decade is most similar to that of Baldwin County and Jones County.
Compare two places, side by side
Twelve curated comparisons line up election history, demographics, and the divergence story for two places at a glance. Browse all comparisons →
Pickens County, South Carolina. Akashic. https://akashic.app/county/45077/. Accessed May 20, 2026. License: CC BY 4.0.