Bon Homme County, South Dakota: Heartland Swing county. In 2024, voted R+51%. Republican peak: R+51 in 2024.
Key facts
- 2024 presidential margin
- R+51MIT Election Lab
- Political typology
- Heartland SwingAkashic typology
- Population
- 7,0442024 5-year
- Median household income
- $64,4352024 5-year
- White (non-Hispanic)
- 86.5%2024 5-year
- Black
- 2.3%2024 5-year
- Hispanic / Latino
- 2.4%2024 5-year
- Peak Democratic margin
- D+45 in 1912MIT Election Lab
- Peak Republican margin
- R+51 in 2024MIT Election Lab
- Most similar
- Clark County, SD · similarity 1.00
| Donald Trump ✓Republican | 74.7% | 2,236 |
|---|---|---|
| Kamala HarrisDemocratic | 23.3% | 697 |
| OtherAll other candidates | 2.0% | 59 |
| Year | Margin (D minus R) |
|---|---|
| 1876 | No data |
| 1880 | No data |
| 1884 | No data |
| 1888 | No data |
| 1892 | −34.9% |
| 1896 | −13.1% |
| 1900 | −10.5% |
| 1904 | −26.6% |
| 1908 | −12.9% |
| 1912 | +44.6% |
| 1916 | −1.8% |
| 1920 | −25.9% |
| 1924 | −16.5% |
| 1928 | −2.2% |
| 1932 | +44.0% |
| 1936 | +13.6% |
| 1940 | −10.6% |
| 1944 | −12.6% |
| 1948 | −4.7% |
| 1952 | −31.1% |
| 1956 | −11.4% |
| 1960 | −14.2% |
| 1964 | +16.6% |
| 1968 | −14.6% |
| 1972 | +5.6% |
| 1976 | +6.3% |
| 1980 | −37.8% |
| 1984 | −27.4% |
| 1988 | −7.4% |
| 1992 | +2.4% |
| 1996 | +4.1% |
| 2000 | +23.5% |
| 2004 | −22.6% |
| 2008 | −10.9% |
| 2012 | −21.6% |
| 2016 | −47.1% |
| 2020 | −50.4% |
| 2024 | −51.4% |
| Year | Won | Margin | Democratic | Republican | Total |
|---|---|---|---|---|---|
| R | 697 | 2,236 | 2,992 | ||
| R | 721 | 2,235 | 3,001 | ||
| R | 704 | 2,105 | 2,974 | ||
| R | 1,167 | 1,830 | 3,074 | ||
| R | 1,367 | 1,712 | 3,175 | ||
| R | 1,293 | 2,063 | 3,408 | ||
| D | 1,901 | 1,162 | 3,139 | ||
| D | 1,569 | 1,428 | 3,436 | ||
| D | 1,294 | 1,212 | 3,367 | ||
| R | 1,574 | 1,826 | 3,417 | ||
| R | 1,408 | 2,478 | 3,906 | ||
| R | 1,191 | 2,794 | 4,239 | ||
| D | 2,154 | 1,897 | 4,073 | ||
| D | 2,368 | 2,116 | 4,493 | ||
| R | 1,773 | 2,411 | 4,383 | ||
| D | 2,494 | 1,784 | 4,278 | ||
| R | 2,052 | 2,730 | 4,782 | ||
| R | 2,144 | 2,696 | 4,840 | ||
| R | 1,658 | 3,157 | 4,815 | ||
| R | 2,077 | 2,283 | 4,408 | ||
| R | 1,981 | 2,553 | 4,534 | ||
| R | 2,463 | 3,046 | 5,509 | ||
| D | 2,959 | 2,236 | 5,299 | ||
| D | 3,504 | 1,354 | 4,886 | ||
| R | 2,166 | 2,262 | 4,441 | ||
| R | 860 | 1,420 | 3,398 | ||
| R | 960 | 1,872 | 3,517 | ||
| R | 1,231 | 1,278 | 2,569 | ||
| O | 1,059 | 0 | 2,372 | ||
| R | 1,014 | 1,324 | 2,396 | ||
| R | 886 | 1,547 | 2,483 | ||
| R | 1,028 | 1,271 | 2,314 | ||
| R | 893 | 1,163 | 2,063 | ||
| R | 260 | 879 | 1,775 | ||
| — | — | — | — | ||
| — | — | — | — | ||
| — | — | — | — | ||
| — | — | — | — |
Demographics
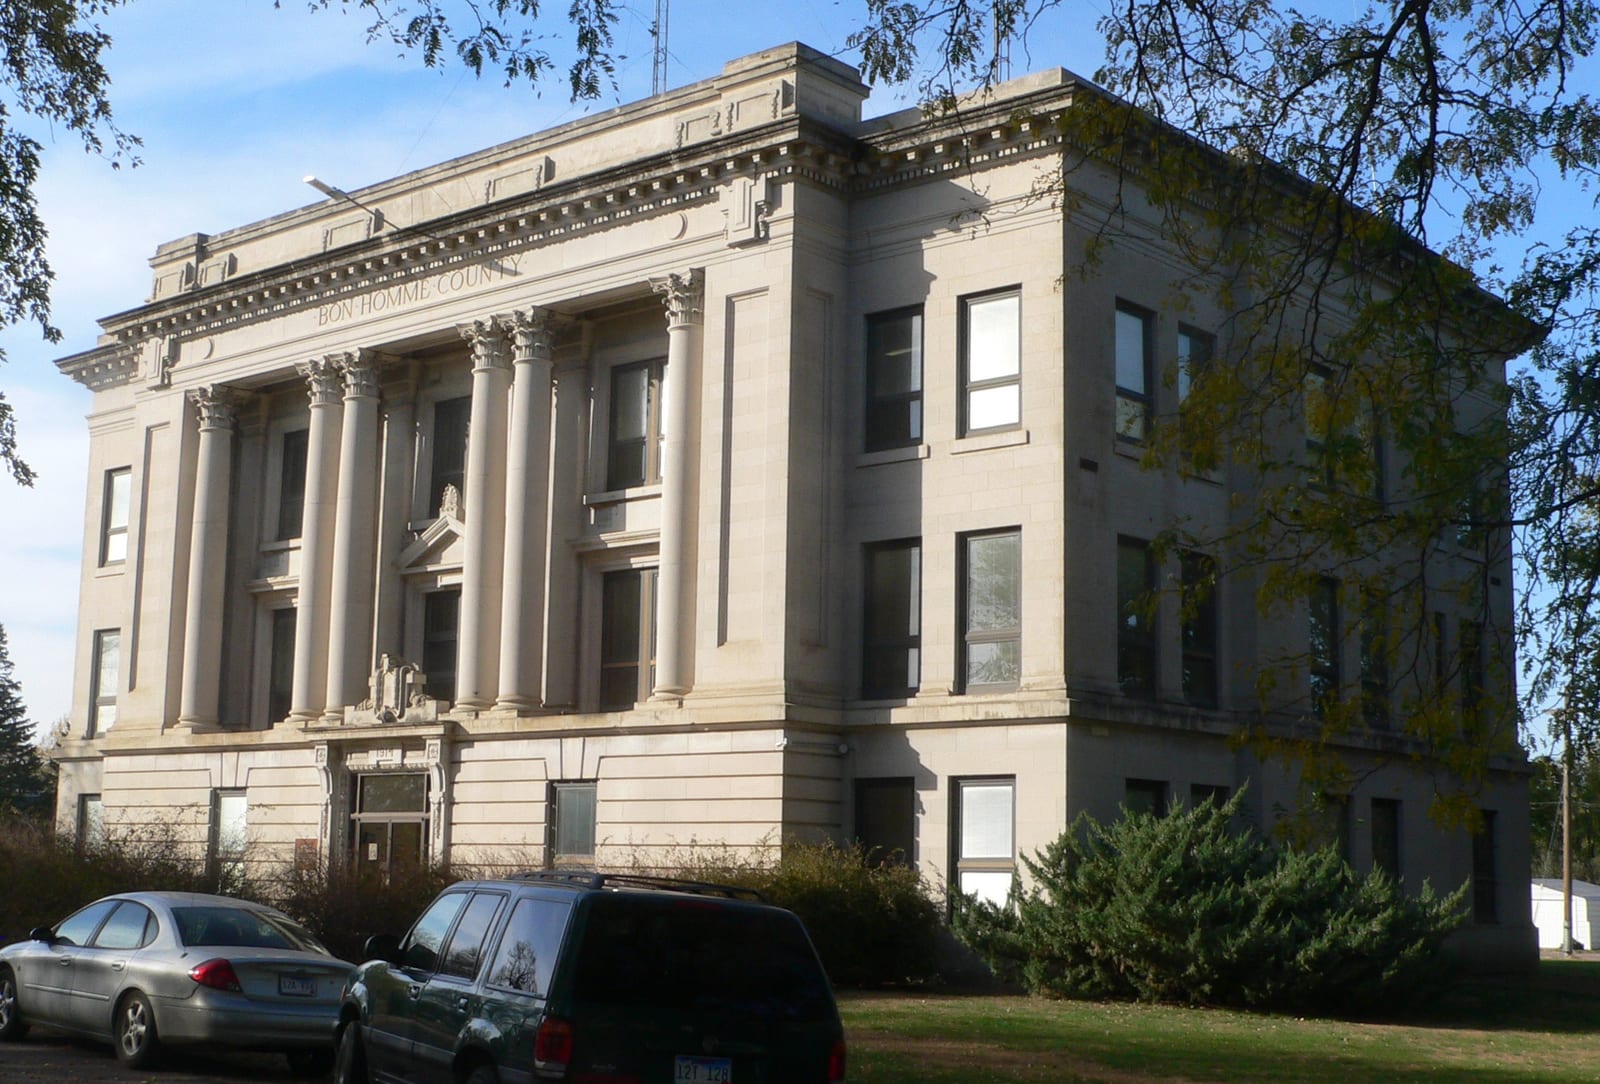
Bon Homme County, anchored by the Missouri River bottomlands and a tight-knit agricultural economy, has delivered Republican presidential margins above 50 points in recent cycles, reflecting the deep-red alignment typical of South Dakota's rural, small-population counties.
The Democratic margin here peaked at forty-five points in 1912. Between 2020 and 2024 the county moved one point toward the Republican candidate; the 2024 margin was fifty-one points.
A population of 7,044, a 87% non-Hispanic-white share, and a median household income of $64,435 describe the county. The county's voting pattern over the last decade is most similar to that of Clark County and Kingsbury County.
Compare two places, side by side
Twelve curated comparisons line up election history, demographics, and the divergence story for two places at a glance. Browse all comparisons →
Bon Homme County, South Dakota. Akashic. https://akashic.app/county/46009/. Accessed May 20, 2026. License: CC BY 4.0.