Johnson County, Texas: Texan Right county. In 2024, voted R+51%. Democratic peak: D+85 in 1936.
Key facts
- 2024 presidential margin
- R+51MIT Election Lab
- Political typology
- Texan RightAkashic typology
- Population
- 195,5972024 5-year
- Median household income
- $84,8592024 5-year
- White (non-Hispanic)
- 71.9%2024 5-year
- Black
- 5.4%2024 5-year
- Hispanic / Latino
- 25.3%2024 5-year
- Peak Democratic margin
- D+85 in 1936MIT Election Lab
- Peak Republican margin
- R+58 in 2016MIT Election Lab
- Most similar
- Wichita County, TX · similarity 1.00
| Donald Trump ✓Republican | 75.1% | 60,752 |
|---|---|---|
| Kamala HarrisDemocratic | 23.8% | 19,247 |
| OtherAll other candidates | 1.2% | 931 |
| Year | Margin (D minus R) |
|---|---|
| 1876 | No data |
| 1880 | No data |
| 1884 | No data |
| 1888 | No data |
| 1892 | No data |
| 1896 | No data |
| 1900 | No data |
| 1904 | No data |
| 1908 | No data |
| 1912 | +77.2% |
| 1916 | +79.1% |
| 1920 | +56.3% |
| 1924 | +65.1% |
| 1928 | −23.2% |
| 1932 | +80.1% |
| 1936 | +84.9% |
| 1940 | +79.0% |
| 1944 | +71.4% |
| 1948 | +64.1% |
| 1952 | +6.0% |
| 1956 | −2.6% |
| 1960 | −7.9% |
| 1964 | +32.5% |
| 1968 | +7.7% |
| 1972 | −43.0% |
| 1976 | +20.2% |
| 1980 | −3.9% |
| 1984 | −33.1% |
| 1988 | −16.6% |
| 1992 | −3.9% |
| 1996 | −10.6% |
| 2000 | −37.2% |
| 2004 | −47.4% |
| 2008 | −47.5% |
| 2012 | −55.6% |
| 2016 | −58.0% |
| 2020 | −53.0% |
| 2024 | −51.3% |
| Year | Won | Margin | Democratic | Republican | Total |
|---|---|---|---|---|---|
| R | 19,247 | 60,752 | 80,930 | ||
| R | 16,464 | 54,628 | 72,020 | ||
| R | 10,988 | 44,382 | 57,606 | ||
| R | 10,496 | 37,661 | 48,838 | ||
| R | 12,912 | 36,685 | 50,050 | ||
| R | 12,325 | 34,818 | 47,422 | ||
| R | 11,778 | 26,202 | 38,726 | ||
| R | 12,817 | 16,246 | 32,473 | ||
| R | 12,030 | 13,473 | 37,202 | ||
| R | 12,507 | 17,509 | 30,171 | ||
| R | 9,148 | 18,254 | 27,474 | ||
| R | 10,542 | 11,411 | 22,454 | ||
| D | 10,864 | 7,194 | 18,127 | ||
| R | 3,968 | 10,042 | 14,136 | ||
| D | 5,330 | 4,372 | 12,411 | ||
| D | 6,381 | 3,251 | 9,642 | ||
| R | 3,844 | 4,510 | 8,431 | ||
| R | 3,560 | 3,750 | 7,340 | ||
| D | 4,496 | 3,985 | 8,485 | ||
| D | 4,042 | 707 | 5,202 | ||
| D | 4,757 | 546 | 5,896 | ||
| D | 5,532 | 649 | 6,183 | ||
| D | 4,281 | 337 | 4,647 | ||
| D | 4,858 | 530 | 5,405 | ||
| R | 1,981 | 3,181 | 5,166 | ||
| D | 4,600 | 851 | 5,761 | ||
| D | 3,041 | 661 | 4,224 | ||
| D | 3,040 | 275 | 3,497 | ||
| D | 2,473 | 109 | 3,063 | ||
| — | — | — | — | ||
| — | — | — | — | ||
| — | — | — | — | ||
| — | — | — | — | ||
| — | — | — | — | ||
| — | — | — | — | ||
| — | — | — | — | ||
| — | — | — | — | ||
| — | — | — | — |
Demographics
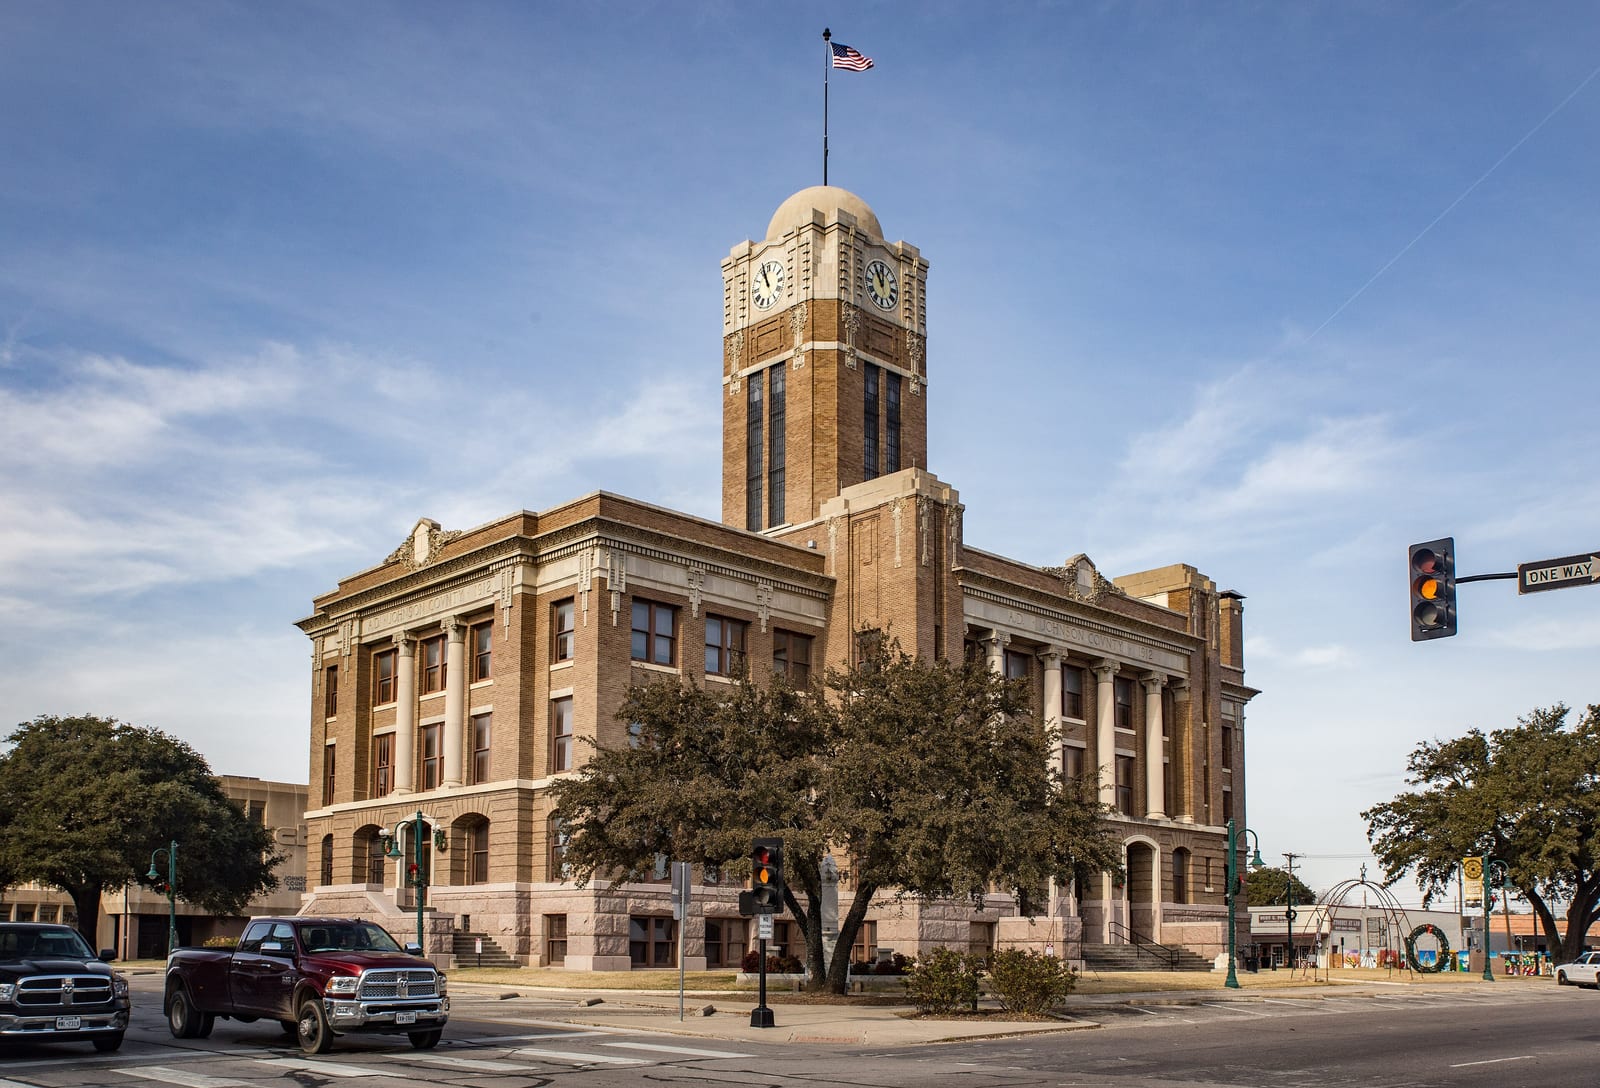
Anchoring the southwestern corner of the Dallas–Fort Worth metroplex, Johnson County has grown steadily as suburban sprawl pushes outward, yet its presidential margins have remained among the widest in the region.
The Republican margin here reached fifty-eight points in 2016. Between 2020 and 2024 the county moved two points toward the Democratic candidate; the 2024 margin was fifty-one points.
A population of 195,597, a 72% non-Hispanic-white share, and a median household income of $84,859 describe the county. The county's voting pattern over the last decade is most similar to that of Wichita County and Brown County. A non-English-speaking share of 18% reflects a meaningful Latino presence that votes, here, with the Republican grain.
Compare two places, side by side
Twelve curated comparisons line up election history, demographics, and the divergence story for two places at a glance. Browse all comparisons →
Johnson County, Texas. Akashic. https://akashic.app/county/48251/. Accessed May 20, 2026. License: CC BY 4.0.