Willacy County, Texas: New American county. In 2024, voted R+3%. Democratic peak: D+91 in 1912.
Key facts
- 2024 presidential margin
- R+3MIT Election Lab
- Political typology
- New AmericanAkashic typology
- Population
- 20,1392024 5-year
- Median household income
- $54,1802024 5-year
- White (non-Hispanic)
- 39.8%2024 5-year
- Black
- 1.5%2024 5-year
- Hispanic / Latino
- 87.3%2024 5-year
- Peak Democratic margin
- D+91 in 1912MIT Election Lab
- Peak Republican margin
- R+26 in 1952MIT Election Lab
- Most similar
- Hidalgo County, TX · similarity 0.99
| Donald Trump ✓Republican | 51.3% | 2,856 |
|---|---|---|
| Kamala HarrisDemocratic | 48.0% | 2,673 |
| OtherAll other candidates | 0.6% | 34 |
| Year | Margin (D minus R) |
|---|---|
| 1876 | No data |
| 1880 | No data |
| 1884 | No data |
| 1888 | No data |
| 1892 | No data |
| 1896 | No data |
| 1900 | No data |
| 1904 | No data |
| 1908 | No data |
| 1912 | +90.7% |
| 1916 | +83.3% |
| 1920 | +71.0% |
| 1924 | +45.4% |
| 1928 | +0.9% |
| 1932 | +60.1% |
| 1936 | +44.7% |
| 1940 | +22.6% |
| 1944 | +5.3% |
| 1948 | +24.1% |
| 1952 | −25.7% |
| 1956 | −13.4% |
| 1960 | +21.3% |
| 1964 | +27.2% |
| 1968 | +18.9% |
| 1972 | −25.0% |
| 1976 | +31.6% |
| 1980 | +20.6% |
| 1984 | +12.9% |
| 1988 | +28.6% |
| 1992 | +33.9% |
| 1996 | +45.4% |
| 2000 | +28.2% |
| 2004 | +10.6% |
| 2008 | +39.8% |
| 2012 | +43.1% |
| 2016 | +36.8% |
| 2020 | +11.9% |
| 2024 | −3.3% |
| Year | Won | Margin | Democratic | Republican | Total |
|---|---|---|---|---|---|
| R | 2,673 | 2,856 | 5,563 | ||
| D | 3,108 | 2,441 | 5,590 | ||
| D | 3,422 | 1,547 | 5,095 | ||
| D | 3,600 | 1,416 | 5,064 | ||
| D | 3,409 | 1,456 | 4,903 | ||
| D | 2,734 | 2,209 | 4,962 | ||
| D | 3,218 | 1,789 | 5,062 | ||
| D | 3,789 | 1,332 | 5,411 | ||
| D | 3,359 | 1,490 | 5,510 | ||
| D | 3,165 | 1,750 | 4,940 | ||
| D | 3,037 | 2,340 | 5,391 | ||
| D | 3,047 | 1,995 | 5,108 | ||
| D | 2,984 | 1,542 | 4,557 | ||
| R | 1,384 | 2,317 | 3,730 | ||
| D | 1,930 | 1,243 | 3,638 | ||
| D | 2,152 | 1,230 | 3,388 | ||
| D | 2,109 | 1,367 | 3,487 | ||
| R | 1,261 | 1,656 | 2,948 | ||
| R | 1,324 | 2,244 | 3,574 | ||
| D | 1,139 | 676 | 1,924 | ||
| D | 846 | 754 | 1,737 | ||
| D | 1,173 | 740 | 1,920 | ||
| D | 1,002 | 376 | 1,399 | ||
| D | 1,042 | 259 | 1,302 | ||
| D | 396 | 389 | 785 | ||
| D | 307 | 110 | 434 | ||
| D | 53 | 9 | 62 | ||
| D | 110 | 10 | 120 | ||
| D | 102 | 5 | 107 | ||
| — | — | — | — | ||
| — | — | — | — | ||
| — | — | — | — | ||
| — | — | — | — | ||
| — | — | — | — | ||
| — | — | — | — | ||
| — | — | — | — | ||
| — | — | — | — | ||
| — | — | — | — |
Demographics
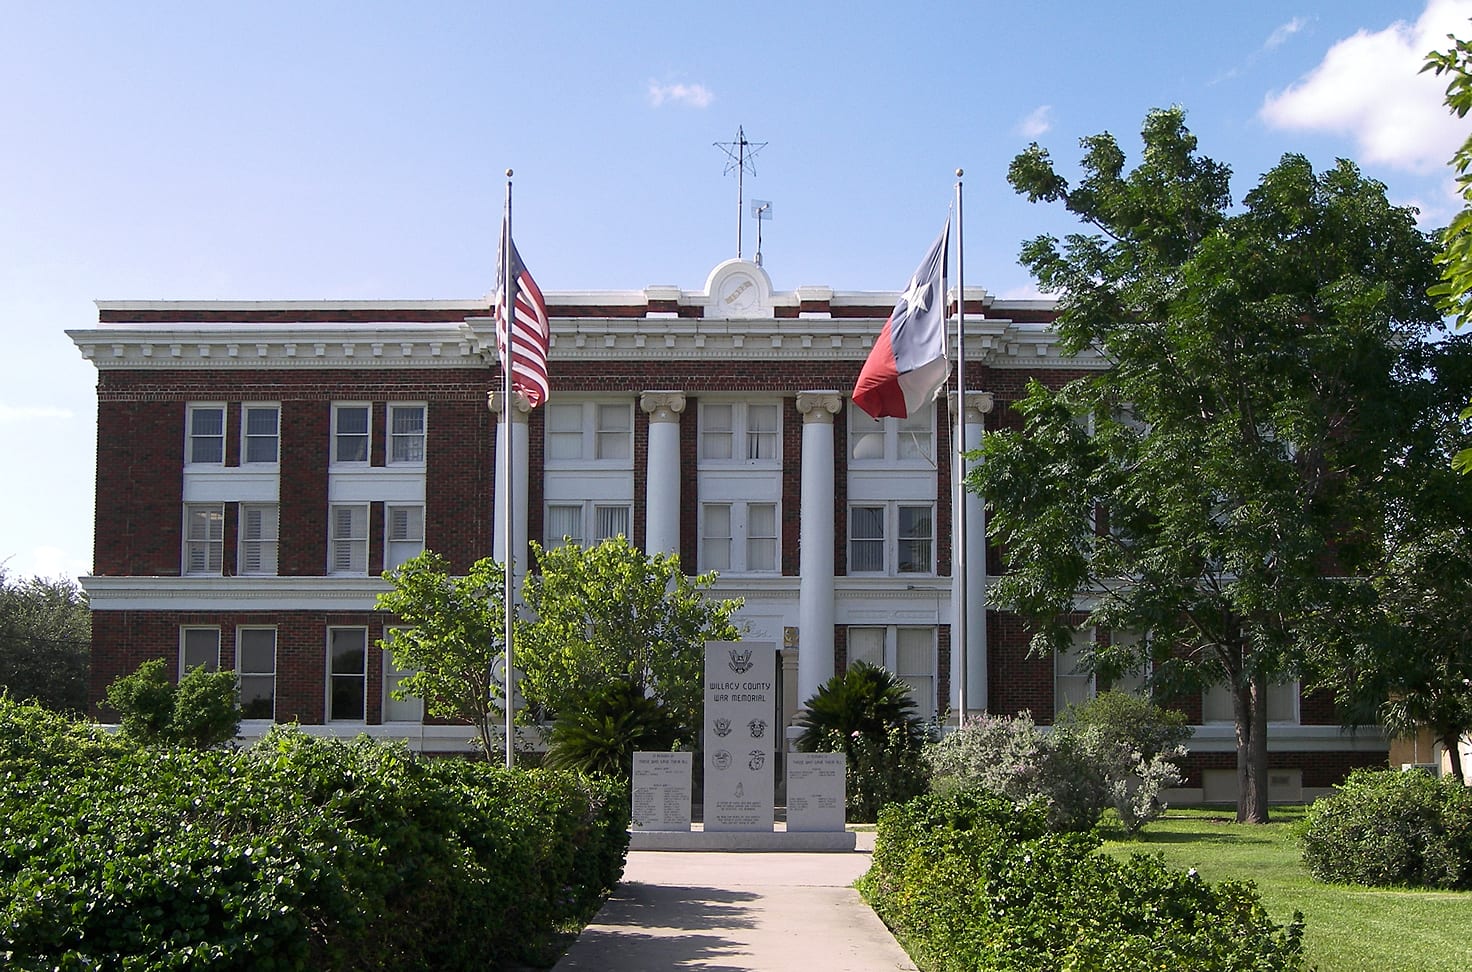
Willacy County, anchored by Raymondville and sitting along the Gulf coastal plain, backed Democratic presidential candidates by double digits as recently as 2016 before narrowing to R+3.3 in 2024—one of the starkest swings among majority-Hispanic counties in the Rio Grande Valley.
Willacy County has leaned Republican in recent presidential elections, reaching a Democratic margin of ninety-one points in 1912. Between 2020 and 2024 it moved fifteen points toward the Republican candidate — part of the sharpest rightward shift recorded among any group of places in the country.
Its demographics describe the shift: a 40% non-Hispanic-white share, a median household income of $54,180, and a population of 20,139. The county's voting pattern over the last decade is most similar to that of Hidalgo County and Maverick County.
Compare two places, side by side
Twelve curated comparisons line up election history, demographics, and the divergence story for two places at a glance. Browse all comparisons →
Willacy County, Texas. Akashic. https://akashic.app/county/48489/. Accessed May 20, 2026. License: CC BY 4.0.