Young County, Texas: Texan Right county. In 2024, voted R+76%. Democratic peak: D+82 in 1936.
Key facts
- 2024 presidential margin
- R+76MIT Election Lab
- Political typology
- Texan RightAkashic typology
- Population
- 18,0292024 5-year
- Median household income
- $68,0102024 5-year
- White (non-Hispanic)
- 81.6%2024 5-year
- Black
- 0.8%2024 5-year
- Hispanic / Latino
- 20.5%2024 5-year
- Peak Democratic margin
- D+82 in 1936MIT Election Lab
- Peak Republican margin
- R+76 in 2024MIT Election Lab
- Most similar
- Chambers County, TX · similarity 1.00
| Donald Trump ✓Republican | 87.8% | 7,298 |
|---|---|---|
| Kamala HarrisDemocratic | 11.6% | 962 |
| OtherAll other candidates | 0.6% | 54 |
| Year | Margin (D minus R) |
|---|---|
| 1876 | No data |
| 1880 | No data |
| 1884 | No data |
| 1888 | No data |
| 1892 | No data |
| 1896 | No data |
| 1900 | No data |
| 1904 | No data |
| 1908 | No data |
| 1912 | +74.8% |
| 1916 | +79.5% |
| 1920 | +68.4% |
| 1924 | +70.7% |
| 1928 | −17.8% |
| 1932 | +81.4% |
| 1936 | +81.7% |
| 1940 | +77.1% |
| 1944 | +69.4% |
| 1948 | +68.2% |
| 1952 | −2.2% |
| 1956 | −1.3% |
| 1960 | +7.8% |
| 1964 | +35.9% |
| 1968 | +11.6% |
| 1972 | −38.6% |
| 1976 | +13.3% |
| 1980 | −20.1% |
| 1984 | −41.0% |
| 1988 | −16.0% |
| 1992 | −5.6% |
| 1996 | −18.7% |
| 2000 | −45.7% |
| 2004 | −58.9% |
| 2008 | −63.5% |
| 2012 | −71.5% |
| 2016 | −74.3% |
| 2020 | −73.7% |
| 2024 | −76.2% |
| Year | Won | Margin | Democratic | Republican | Total |
|---|---|---|---|---|---|
| R | 962 | 7,298 | 8,314 | ||
| R | 1,034 | 7,110 | 8,239 | ||
| R | 876 | 6,601 | 7,707 | ||
| R | 992 | 6,225 | 7,316 | ||
| R | 1,303 | 5,942 | 7,305 | ||
| R | 1,511 | 5,874 | 7,409 | ||
| R | 1,843 | 5,022 | 6,954 | ||
| R | 2,394 | 3,647 | 6,697 | ||
| R | 2,464 | 2,894 | 7,675 | ||
| R | 3,007 | 4,156 | 7,193 | ||
| R | 2,203 | 5,282 | 7,503 | ||
| R | 2,740 | 4,153 | 7,022 | ||
| D | 3,473 | 2,652 | 6,166 | ||
| R | 1,486 | 3,353 | 4,840 | ||
| D | 2,482 | 1,860 | 5,346 | ||
| D | 3,395 | 1,600 | 4,996 | ||
| D | 2,419 | 2,067 | 4,509 | ||
| R | 2,028 | 2,083 | 4,130 | ||
| R | 2,536 | 2,649 | 5,192 | ||
| D | 3,175 | 516 | 3,898 | ||
| D | 3,183 | 327 | 4,114 | ||
| D | 3,712 | 478 | 4,195 | ||
| D | 3,065 | 304 | 3,381 | ||
| D | 3,156 | 320 | 3,482 | ||
| R | 1,275 | 1,826 | 3,101 | ||
| D | 2,000 | 322 | 2,373 | ||
| D | 1,214 | 209 | 1,470 | ||
| D | 1,175 | 71 | 1,388 | ||
| D | 922 | 35 | 1,186 | ||
| — | — | — | — | ||
| — | — | — | — | ||
| — | — | — | — | ||
| — | — | — | — | ||
| — | — | — | — | ||
| — | — | — | — | ||
| — | — | — | — | ||
| — | — | — | — | ||
| — | — | — | — |
Demographics
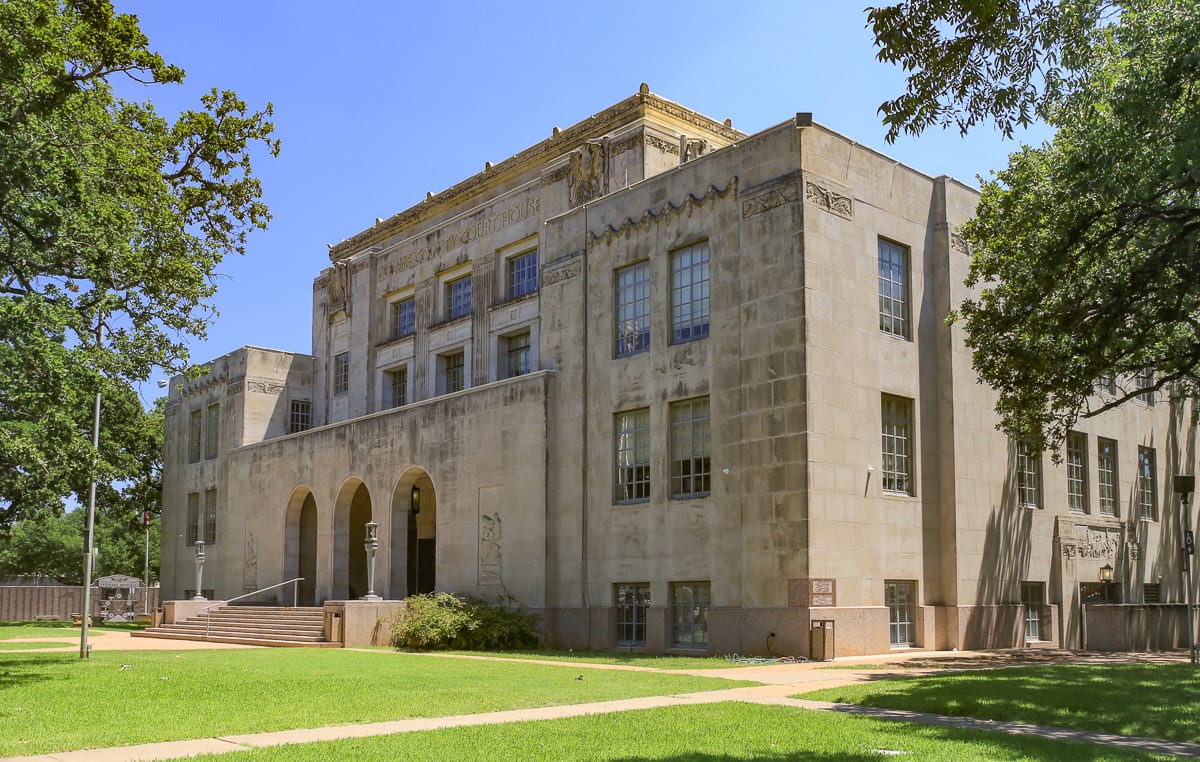
Young County, anchored by the small city of Graham, delivered an R+76.2 margin in 2024 — among the widest in the state — reflecting the deep red realignment that has reshaped rural North Texas over the past two decades.
The Republican margin here reached seventy-six points in 2024. Between 2020 and 2024 the county moved two points toward the Republican candidate; the 2024 margin was seventy-six points.
A population of 18,029, a 82% non-Hispanic-white share, and a median household income of $68,010 describe the county. The county's voting pattern over the last decade is most similar to that of Chambers County and Callahan County. A non-English-speaking share of 16% reflects a meaningful Latino presence that votes, here, with the Republican grain.
Compare two places, side by side
Twelve curated comparisons line up election history, demographics, and the divergence story for two places at a glance. Browse all comparisons →
Young County, Texas. Akashic. https://akashic.app/county/48503/. Accessed May 20, 2026. License: CC BY 4.0.