Phillips County, Arkansas: Black Belt county. In 2024, voted D+13%. Democratic peak: D+92 in 1936.
Key facts
- 2024 presidential margin
- D+13MIT Election Lab
- Political typology
- Black BeltAkashic typology
- Population
- 15,4502024 5-year
- Median household income
- $40,1342024 5-year
- White (non-Hispanic)
- 33.9%2024 5-year
- Black
- 60.5%2024 5-year
- Hispanic / Latino
- 2.1%2024 5-year
- Peak Democratic margin
- D+92 in 1936MIT Election Lab
- Peak Republican margin
- R+18 in 1972MIT Election Lab
- Most similar
- Talbot County, GA · similarity 1.00
| Kamala Harris ✓Democratic | 55.8% | 2,754 |
|---|---|---|
| Donald TrumpRepublican | 42.5% | 2,098 |
| OtherAll other candidates | 1.7% | 86 |
| Year | Margin (D minus R) |
|---|---|
| 1876 | No data |
| 1880 | No data |
| 1884 | No data |
| 1888 | No data |
| 1892 | +5.1% |
| 1896 | +13.7% |
| 1900 | +55.1% |
| 1904 | +69.9% |
| 1908 | +50.3% |
| 1912 | +55.4% |
| 1916 | +45.3% |
| 1920 | +38.6% |
| 1924 | +57.6% |
| 1928 | +61.7% |
| 1932 | +90.1% |
| 1936 | +91.6% |
| 1940 | +80.2% |
| 1944 | +60.6% |
| 1948 | +21.5% |
| 1952 | +18.1% |
| 1956 | +15.7% |
| 1960 | +29.0% |
| 1964 | +18.9% |
| 1968 | +25.1% |
| 1972 | −18.4% |
| 1976 | +39.9% |
| 1980 | +21.3% |
| 1984 | +11.8% |
| 1988 | +17.1% |
| 1992 | +38.2% |
| 1996 | +41.0% |
| 2000 | +30.8% |
| 2004 | +28.0% |
| 2008 | +29.0% |
| 2012 | +32.8% |
| 2016 | +27.3% |
| 2020 | +19.3% |
| 2024 | +13.3% |
| Year | Won | Margin | Democratic | Republican | Total |
|---|---|---|---|---|---|
| D | 2,754 | 2,098 | 4,938 | ||
| D | 3,623 | 2,417 | 6,242 | ||
| D | 4,310 | 2,446 | 6,818 | ||
| D | 5,202 | 2,598 | 7,930 | ||
| D | 5,695 | 3,097 | 8,969 | ||
| D | 5,642 | 3,161 | 8,868 | ||
| D | 6,018 | 3,154 | 9,313 | ||
| D | 5,715 | 2,205 | 8,570 | ||
| D | 6,456 | 2,695 | 9,837 | ||
| D | 5,580 | 3,892 | 9,861 | ||
| D | 5,946 | 4,686 | 10,723 | ||
| D | 6,642 | 4,270 | 11,146 | ||
| D | 7,774 | 3,342 | 11,117 | ||
| R | 4,283 | 6,235 | 10,586 | ||
| D | 5,039 | 2,154 | 11,472 | ||
| D | 5,818 | 3,963 | 9,790 | ||
| D | 4,105 | 2,168 | 6,677 | ||
| D | 3,917 | 2,826 | 6,940 | ||
| D | 3,741 | 2,592 | 6,340 | ||
| O | 1,018 | 351 | 3,099 | ||
| D | 2,046 | 501 | 2,548 | ||
| D | 2,235 | 245 | 2,480 | ||
| D | 2,259 | 94 | 2,363 | ||
| D | 2,976 | 142 | 3,144 | ||
| D | 2,061 | 487 | 2,552 | ||
| D | 1,785 | 454 | 2,310 | ||
| D | 1,965 | 868 | 2,842 | ||
| D | 1,466 | 552 | 2,018 | ||
| D | 926 | 198 | 1,315 | ||
| D | 1,194 | 393 | 1,594 | ||
| D | 1,434 | 251 | 1,692 | ||
| D | 1,349 | 388 | 1,745 | ||
| D | 1,085 | 815 | 1,978 | ||
| D | 1,481 | 1,331 | 2,917 | ||
| — | — | — | — | ||
| — | — | — | — | ||
| — | — | — | — | ||
| — | — | — | — |
Demographics
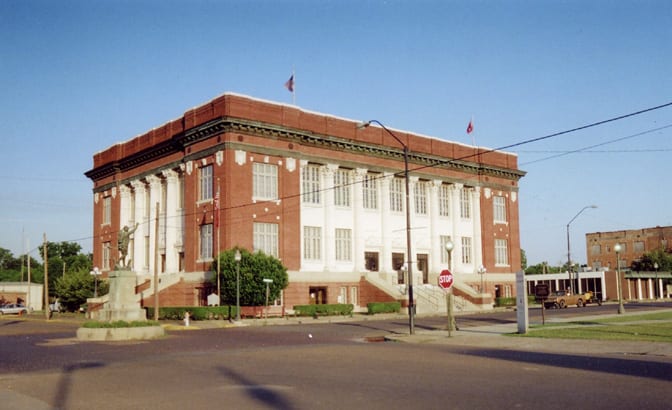
Phillips County, anchored by Helena-West Helena on the Mississippi River, is one of the few Arkansas counties to consistently return Democratic margins, driven by a population that is roughly 60% Black in a state that votes heavily Republican statewide.
The Democratic margin here reached ninety-two points in 1936. Between 2020 and 2024 the county moved six points toward the Republican candidate; the 2024 margin was thirteen points. The recent movement, modest against a deep Democratic baseline, mirrors a broader rightward drift across the Black Belt.
The economic context is part of the story: a median household income of $40,134 and a 29% poverty rate. The county's voting pattern over the last decade is most similar to that of Talbot County and Taliaferro County.
Compare two places, side by side
Twelve curated comparisons line up election history, demographics, and the divergence story for two places at a glance. Browse all comparisons →
Phillips County, Arkansas. Akashic. https://akashic.app/county/05107/. Accessed May 20, 2026. License: CC BY 4.0.