Alamosa County, Colorado: Florida Surge county. In 2024, voted R+11%. Democratic peak: D+44 in 1916.
Key facts
- 2024 presidential margin
- R+11MIT Election Lab
- Political typology
- Florida SurgeAkashic typology
- Population
- 16,5812024 5-year
- Median household income
- $55,3972024 5-year
- White (non-Hispanic)
- 57.8%2024 5-year
- Black
- 1.9%2024 5-year
- Hispanic / Latino
- 48.2%2024 5-year
- Peak Democratic margin
- D+44 in 1916MIT Election Lab
- Peak Republican margin
- R+29 in 1972MIT Election Lab
- Most similar
- Jasper County, MS · similarity 0.89
| Donald Trump ✓Republican | 53.9% | 4,057 |
|---|---|---|
| Kamala HarrisDemocratic | 43.1% | 3,244 |
| OtherAll other candidates | 3.0% | 228 |
| Year | Margin (D minus R) |
|---|---|
| 1876 | No data |
| 1880 | No data |
| 1884 | No data |
| 1888 | No data |
| 1892 | No data |
| 1896 | No data |
| 1900 | No data |
| 1904 | No data |
| 1908 | No data |
| 1912 | No data |
| 1916 | +43.9% |
| 1920 | −6.3% |
| 1924 | −15.4% |
| 1928 | −17.2% |
| 1932 | +23.6% |
| 1936 | +39.2% |
| 1940 | +4.7% |
| 1944 | −3.4% |
| 1948 | +10.2% |
| 1952 | −25.1% |
| 1956 | −24.9% |
| 1960 | −11.3% |
| 1964 | +25.0% |
| 1968 | −17.0% |
| 1972 | −29.5% |
| 1976 | −11.3% |
| 1980 | −16.2% |
| 1984 | −26.2% |
| 1988 | −8.8% |
| 1992 | +7.7% |
| 1996 | +5.9% |
| 2000 | −7.1% |
| 2004 | −2.6% |
| 2008 | +14.1% |
| 2012 | +16.5% |
| 2016 | +2.1% |
| 2020 | −0.7% |
| 2024 | −10.8% |
| Year | Won | Margin | Democratic | Republican | Total |
|---|---|---|---|---|---|
| R | 3,244 | 4,057 | 7,529 | ||
| R | 3,759 | 3,813 | 7,808 | ||
| D | 3,189 | 3,046 | 6,939 | ||
| D | 3,811 | 2,705 | 6,715 | ||
| D | 3,521 | 2,635 | 6,286 | ||
| R | 3,017 | 3,179 | 6,279 | ||
| R | 2,455 | 2,857 | 5,659 | ||
| D | 2,330 | 2,038 | 4,943 | ||
| D | 1,928 | 1,572 | 4,617 | ||
| R | 2,146 | 2,567 | 4,780 | ||
| R | 1,720 | 2,953 | 4,711 | ||
| R | 1,821 | 2,601 | 4,828 | ||
| R | 2,052 | 2,599 | 4,857 | ||
| R | 1,540 | 2,916 | 4,665 | ||
| R | 1,574 | 2,277 | 4,140 | ||
| D | 2,481 | 1,488 | 3,976 | ||
| R | 1,811 | 2,271 | 4,086 | ||
| R | 1,465 | 2,442 | 3,918 | ||
| R | 1,626 | 2,728 | 4,391 | ||
| D | 2,395 | 1,950 | 4,374 | ||
| R | 1,806 | 1,933 | 3,749 | ||
| D | 2,467 | 2,243 | 4,733 | ||
| D | 2,754 | 1,188 | 3,999 | ||
| D | 2,141 | 1,306 | 3,534 | ||
| R | 1,239 | 1,759 | 3,021 | ||
| R | 625 | 1,009 | 2,486 | ||
| R | 949 | 1,081 | 2,084 | ||
| D | 1,308 | 488 | 1,866 | ||
| — | — | — | — | ||
| — | — | — | — | ||
| — | — | — | — | ||
| — | — | — | — | ||
| — | — | — | — | ||
| — | — | — | — | ||
| — | — | — | — | ||
| — | — | — | — | ||
| — | — | — | — | ||
| — | — | — | — |
Demographics
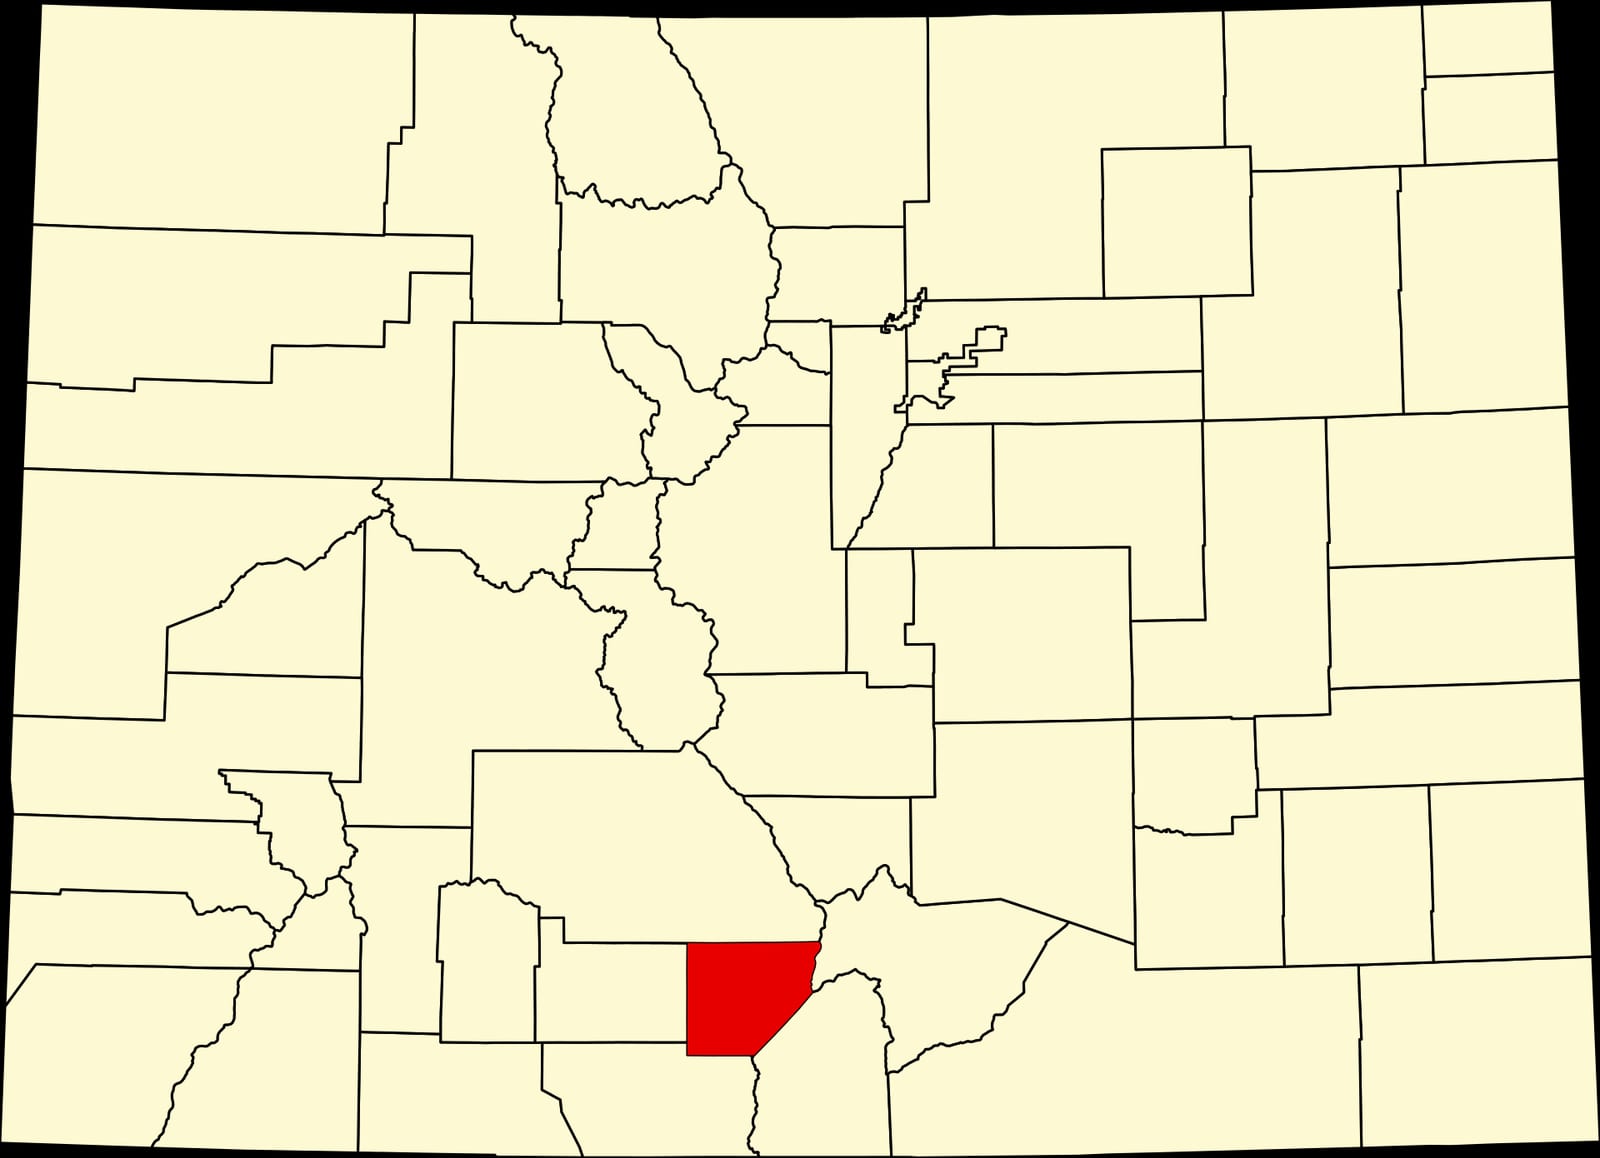
Alamosa County anchors Colorado's high-altitude San Luis Valley, where a majority-Hispanic population has historically leaned Democratic but shifted toward Republicans by double digits in the 2024 presidential race.
The Democratic margin here once reached forty-four points in 1916. Between 2020 and 2024 the county moved ten points toward the Republican candidate; the 2024 margin was eleven points.
A population of 16,581, a 58% non-Hispanic-white share, and a median household income of $55,397 describe the county. The county's voting pattern over the last decade is most similar to that of Jasper County and Richland County.
Compare two places, side by side
Twelve curated comparisons line up election history, demographics, and the divergence story for two places at a glance. Browse all comparisons →
Alamosa County, Colorado. Akashic. https://akashic.app/county/08003/. Accessed May 20, 2026. License: CC BY 4.0.