Chaffee County, Colorado: Realigning Affluent Suburb county. In 2024, voted D+14%. Democratic peak: D+89 in 1896.
Key facts
- 2024 presidential margin
- D+14MIT Election Lab
- Political typology
- Realigning Affluent SuburbAkashic typology
- Population
- 20,1782024 5-year
- Median household income
- $84,1322024 5-year
- White (non-Hispanic)
- 87.3%2024 5-year
- Black
- 1.3%2024 5-year
- Hispanic / Latino
- 9.8%2024 5-year
- Peak Democratic margin
- D+89 in 1896MIT Election Lab
- Peak Republican margin
- R+40 in 1892MIT Election Lab
- Most similar
- Deschutes County, OR · similarity 0.94
| Kamala Harris ✓Democratic | 55.4% | 7,992 |
|---|---|---|
| Donald TrumpRepublican | 41.8% | 6,034 |
| OtherAll other candidates | 2.8% | 397 |
| Year | Margin (D minus R) |
|---|---|
| 1876 | No data |
| 1880 | +2.3% |
| 1884 | −7.3% |
| 1888 | −14.8% |
| 1892 | −40.1% |
| 1896 | +89.2% |
| 1900 | +28.5% |
| 1904 | −0.3% |
| 1908 | +13.8% |
| 1912 | +27.0% |
| 1916 | +47.9% |
| 1920 | −9.4% |
| 1924 | −23.5% |
| 1928 | −20.6% |
| 1932 | +36.7% |
| 1936 | +37.6% |
| 1940 | +5.3% |
| 1944 | +1.6% |
| 1948 | +16.5% |
| 1952 | −13.8% |
| 1956 | −27.3% |
| 1960 | −4.4% |
| 1964 | +25.0% |
| 1968 | −10.9% |
| 1972 | −35.1% |
| 1976 | −16.7% |
| 1980 | −31.8% |
| 1984 | −34.3% |
| 1988 | −9.3% |
| 1992 | −2.1% |
| 1996 | −4.4% |
| 2000 | −20.1% |
| 2004 | −12.6% |
| 2008 | −0.1% |
| 2012 | +0.2% |
| 2016 | −4.5% |
| 2020 | +6.8% |
| 2024 | +13.6% |
| Year | Won | Margin | Democratic | Republican | Total |
|---|---|---|---|---|---|
| D | 7,992 | 6,034 | 14,423 | ||
| D | 7,160 | 6,222 | 13,717 | ||
| R | 4,888 | 5,391 | 11,250 | ||
| D | 5,086 | 5,070 | 10,462 | ||
| R | 4,861 | 4,873 | 9,920 | ||
| R | 3,766 | 4,875 | 8,770 | ||
| R | 2,768 | 4,300 | 7,610 | ||
| R | 2,768 | 3,052 | 6,515 | ||
| R | 2,284 | 2,419 | 6,282 | ||
| R | 2,548 | 3,080 | 5,714 | ||
| R | 1,779 | 3,680 | 5,550 | ||
| R | 1,583 | 3,327 | 5,478 | ||
| R | 2,064 | 2,925 | 5,162 | ||
| R | 1,354 | 2,859 | 4,291 | ||
| R | 1,667 | 2,121 | 4,153 | ||
| D | 2,463 | 1,476 | 3,951 | ||
| R | 1,918 | 2,094 | 4,016 | ||
| R | 1,303 | 2,284 | 3,587 | ||
| R | 1,643 | 2,171 | 3,829 | ||
| D | 2,065 | 1,476 | 3,580 | ||
| D | 1,731 | 1,675 | 3,430 | ||
| D | 2,153 | 1,933 | 4,121 | ||
| D | 2,447 | 1,069 | 3,664 | ||
| D | 2,393 | 1,061 | 3,628 | ||
| R | 1,230 | 1,880 | 3,160 | ||
| R | 612 | 1,336 | 3,078 | ||
| R | 1,233 | 1,501 | 2,837 | ||
| D | 2,546 | 864 | 3,513 | ||
| D | 1,641 | 723 | 3,395 | ||
| D | 1,679 | 1,233 | 3,225 | ||
| R | 1,601 | 1,611 | 3,435 | ||
| D | 1,890 | 1,033 | 3,002 | ||
| D | 2,606 | 141 | 2,762 | ||
| O | 0 | 678 | 1,690 | ||
| R | 941 | 1,277 | 2,272 | ||
| R | 986 | 1,142 | 2,136 | ||
| D | 1,188 | 1,135 | 2,340 | ||
| — | — | — | — |
Demographics
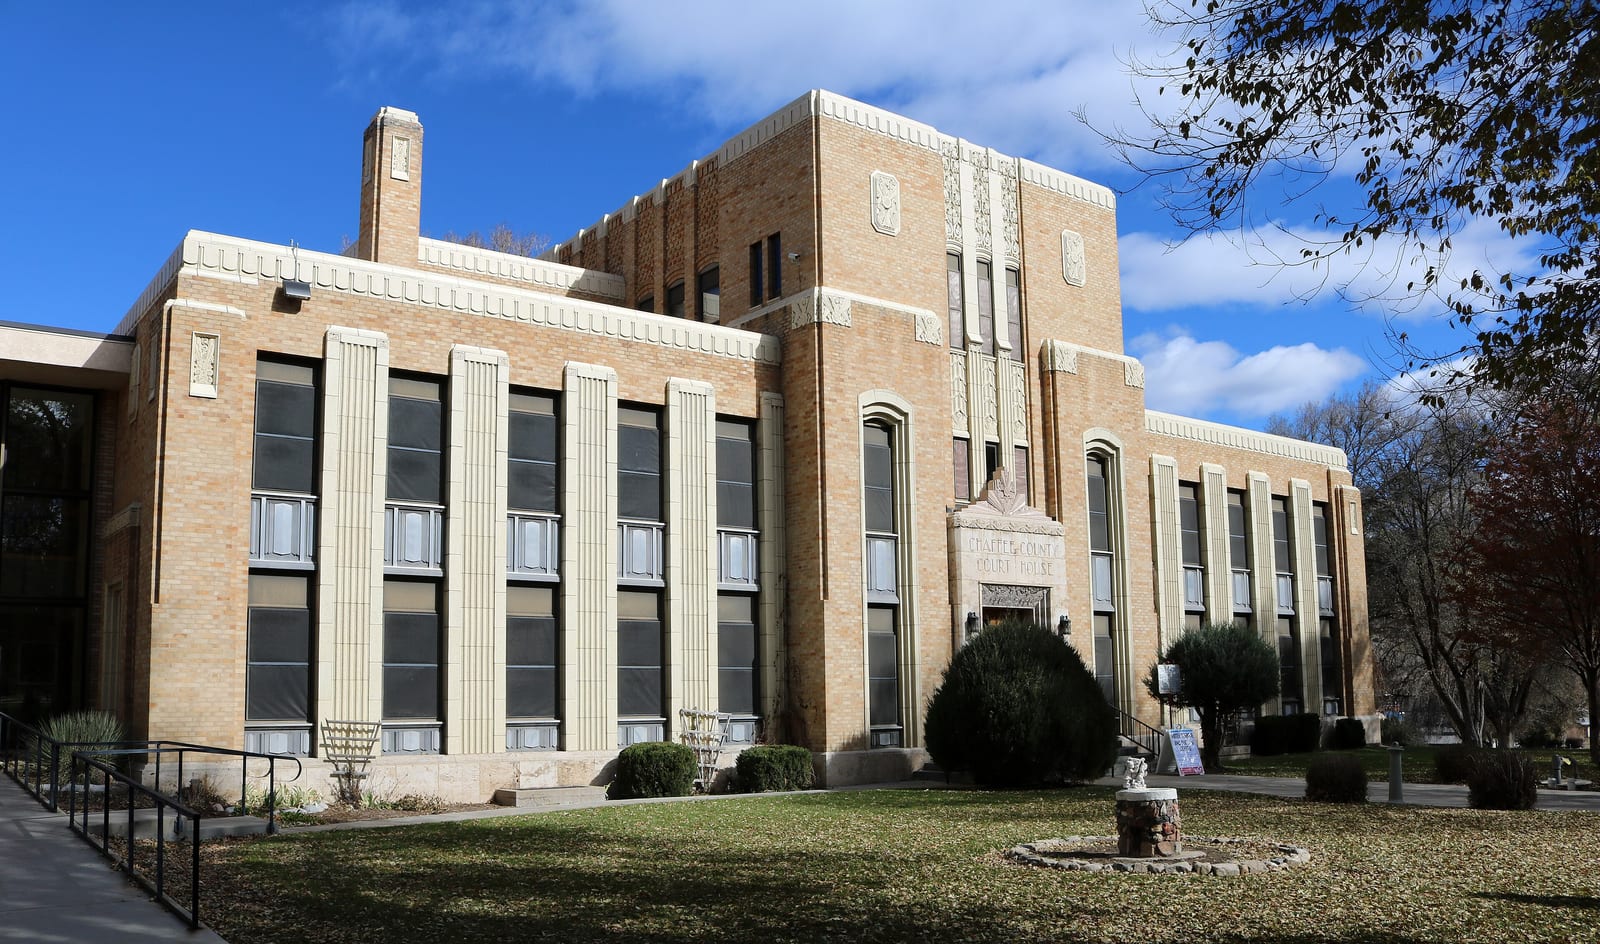
Chaffee County, anchored by Salida and Buena Vista along the Arkansas River, swung Democratic by nearly 14 points in 2024—an unusually strong margin for a rural Colorado county shaped by outdoor recreation and in-migration from urban Colorado.
Once reliably Republican — a margin of forty points in 1892 at its widest — Chaffee County has trended Democratic. Between 2020 and 2024 the county moved seven points toward the Democratic candidate; the 2024 margin was fourteen points.
A median household income of $84,132 — among the higher at this geographic scale — and a population of 20,178 describe the county. The county's voting pattern over the last decade is most similar to that of Deschutes County and Newton County.
Compare two places, side by side
Twelve curated comparisons line up election history, demographics, and the divergence story for two places at a glance. Browse all comparisons →
Chaffee County, Colorado. Akashic. https://akashic.app/county/08015/. Accessed May 20, 2026. License: CC BY 4.0.