Kiowa County, Colorado: Stable Rural Right county. In 2024, voted R+74%. Republican peak: R+77 in 2020.
Key facts
- 2024 presidential margin
- R+74MIT Election Lab
- Political typology
- Stable Rural RightAkashic typology
- Population
- 1,3762024 5-year
- Median household income
- $58,6182024 5-year
- White (non-Hispanic)
- 88.6%2024 5-year
- Black
- 0.0%2024 5-year
- Hispanic / Latino
- 12.9%2024 5-year
- Peak Democratic margin
- D+24 in 1912MIT Election Lab
- Peak Republican margin
- R+77 in 2020MIT Election Lab
- Most similar
- Garrard County, KY · similarity 1.00
| Donald Trump ✓Republican | 86.2% | 744 |
|---|---|---|
| Kamala HarrisDemocratic | 11.8% | 102 |
| OtherAll other candidates | 2.0% | 17 |
| Year | Margin (D minus R) |
|---|---|
| 1876 | No data |
| 1880 | No data |
| 1884 | No data |
| 1888 | No data |
| 1892 | −53.5% |
| 1896 | +7.6% |
| 1900 | −2.4% |
| 1904 | −17.6% |
| 1908 | −7.5% |
| 1912 | +24.5% |
| 1916 | +11.7% |
| 1920 | −23.7% |
| 1924 | −22.1% |
| 1928 | −37.4% |
| 1932 | +17.5% |
| 1936 | +8.4% |
| 1940 | −24.3% |
| 1944 | −29.9% |
| 1948 | −6.9% |
| 1952 | −43.0% |
| 1956 | −29.3% |
| 1960 | −26.9% |
| 1964 | +9.5% |
| 1968 | −21.7% |
| 1972 | −38.2% |
| 1976 | −6.1% |
| 1980 | −36.5% |
| 1984 | −51.8% |
| 1988 | −23.5% |
| 1992 | −17.7% |
| 1996 | −34.2% |
| 2000 | −53.4% |
| 2004 | −60.5% |
| 2008 | −55.4% |
| 2012 | −68.1% |
| 2016 | −74.5% |
| 2020 | −77.2% |
| 2024 | −74.4% |
| Year | Won | Margin | Democratic | Republican | Total |
|---|---|---|---|---|---|
| R | 102 | 744 | 863 | ||
| R | 98 | 795 | 903 | ||
| R | 91 | 728 | 855 | ||
| R | 118 | 677 | 821 | ||
| R | 178 | 650 | 852 | ||
| R | 172 | 712 | 892 | ||
| R | 211 | 728 | 968 | ||
| R | 246 | 549 | 886 | ||
| R | 290 | 472 | 1,030 | ||
| R | 398 | 645 | 1,053 | ||
| R | 265 | 850 | 1,130 | ||
| R | 331 | 754 | 1,159 | ||
| R | 529 | 598 | 1,137 | ||
| R | 372 | 849 | 1,250 | ||
| R | 423 | 689 | 1,224 | ||
| D | 701 | 579 | 1,280 | ||
| R | 498 | 865 | 1,364 | ||
| R | 443 | 810 | 1,253 | ||
| R | 412 | 1,047 | 1,478 | ||
| R | 659 | 758 | 1,431 | ||
| R | 522 | 970 | 1,498 | ||
| R | 598 | 986 | 1,594 | ||
| D | 918 | 772 | 1,732 | ||
| D | 1,113 | 769 | 1,968 | ||
| R | 458 | 1,024 | 1,515 | ||
| R | 431 | 805 | 1,695 | ||
| R | 521 | 864 | 1,449 | ||
| D | 936 | 723 | 1,827 | ||
| D | 638 | 273 | 1,490 | ||
| R | 406 | 474 | 912 | ||
| R | 124 | 180 | 318 | ||
| R | 144 | 151 | 297 | ||
| D | 155 | 133 | 290 | ||
| R | 0 | 151 | 282 | ||
| — | — | — | — | ||
| — | — | — | — | ||
| — | — | — | — | ||
| — | — | — | — |
Demographics
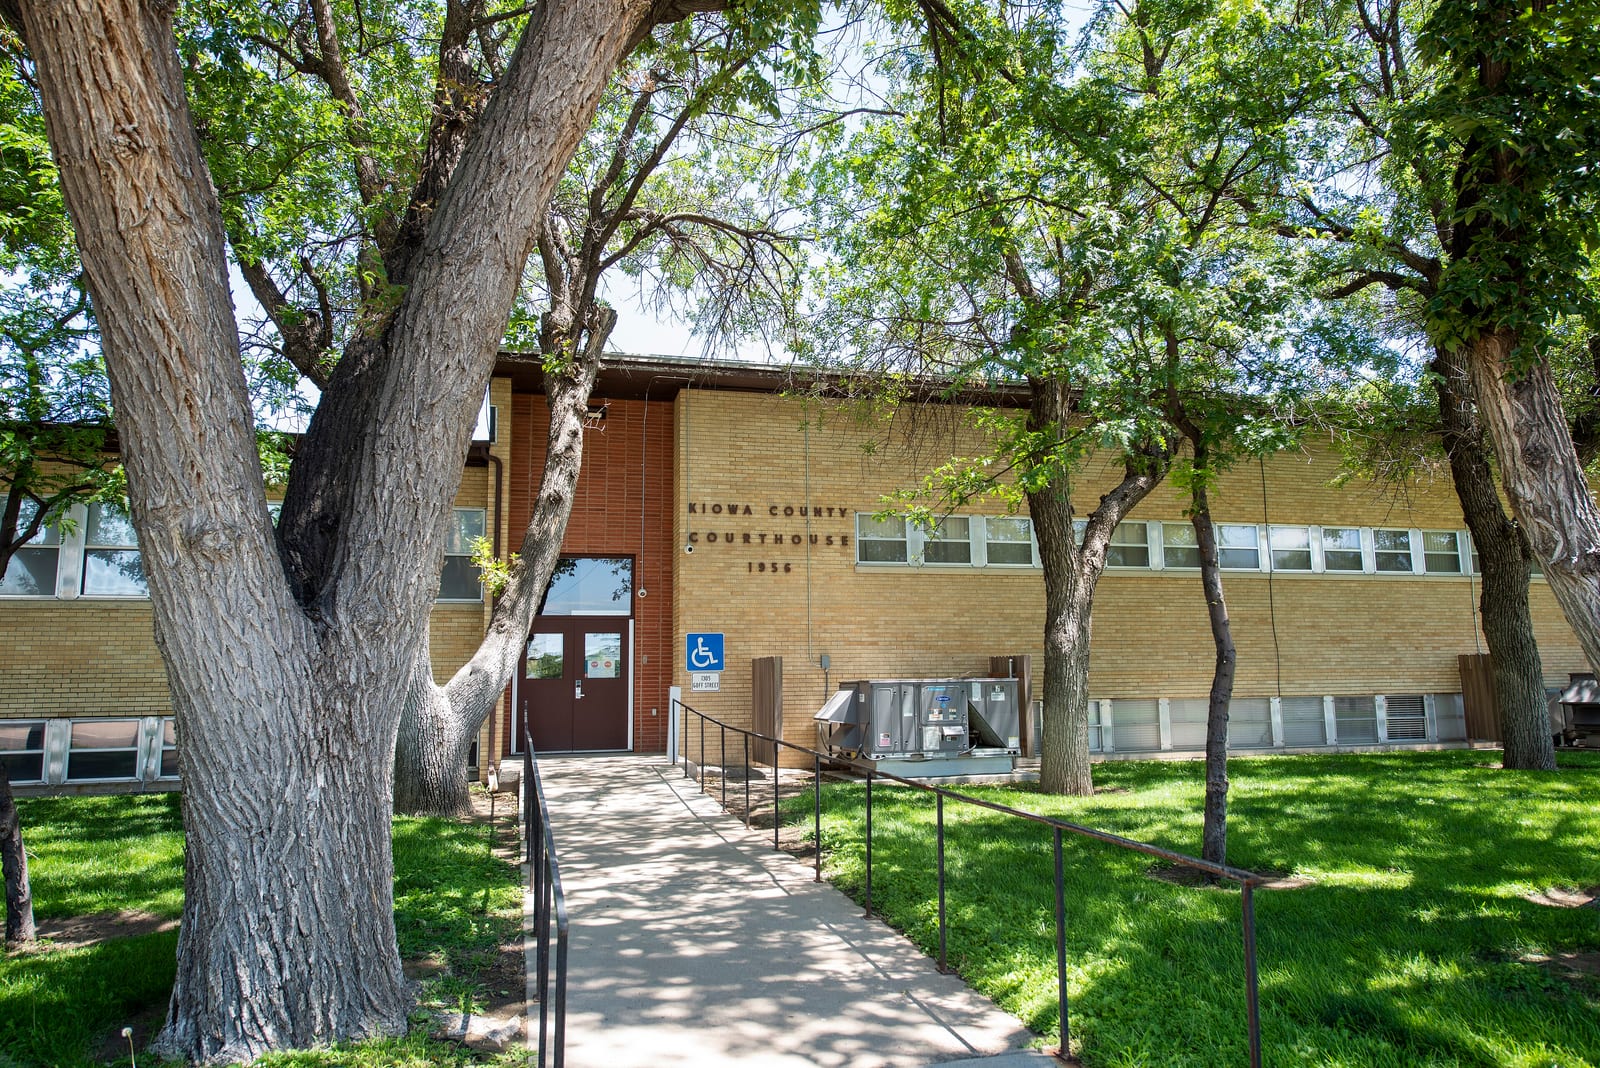
Kiowa County sits on the shortgrass plains of southeastern Colorado, where cattle ranching defines the economy and a sparse, rural electorate has produced some of the state's widest presidential margins for decades.
The Republican margin here reached seventy-seven points in 2020. Between 2020 and 2024 the county moved three points toward the Democratic candidate; the 2024 margin was seventy-four points.
A population of 1,376, a 89% non-Hispanic-white share, and a median household income of $58,618 describe the county. The county's voting pattern over the last decade is most similar to that of Garrard County and Yuma County.
Compare two places, side by side
Twelve curated comparisons line up election history, demographics, and the divergence story for two places at a glance. Browse all comparisons →
Kiowa County, Colorado. Akashic. https://akashic.app/county/08061/. Accessed May 20, 2026. License: CC BY 4.0.