Larimer County, Colorado: Realigning Affluent Suburb county. In 2024, voted D+18%. Democratic peak: D+61 in 1896.
Key facts
- 2024 presidential margin
- D+18MIT Election Lab
- Political typology
- Realigning Affluent SuburbAkashic typology
- Population
- 367,3682024 5-year
- Median household income
- $93,7652024 5-year
- White (non-Hispanic)
- 82.4%2024 5-year
- Black
- 1.1%2024 5-year
- Hispanic / Latino
- 12.9%2024 5-year
- Peak Democratic margin
- D+61 in 1896MIT Election Lab
- Peak Republican margin
- R+47 in 1924MIT Election Lab
- Most similar
- Jefferson County, CO · similarity 0.97
| Kamala Harris ✓Democratic | 57.3% | 129,376 |
|---|---|---|
| Donald TrumpRepublican | 39.7% | 89,680 |
| OtherAll other candidates | 2.9% | 6,598 |
| Year | Margin (D minus R) |
|---|---|
| 1876 | No data |
| 1880 | −21.3% |
| 1884 | −20.5% |
| 1888 | −24.4% |
| 1892 | −43.0% |
| 1896 | +60.7% |
| 1900 | +2.2% |
| 1904 | −31.3% |
| 1908 | −9.8% |
| 1912 | +9.3% |
| 1916 | +25.3% |
| 1920 | −32.6% |
| 1924 | −46.6% |
| 1928 | −43.3% |
| 1932 | −3.9% |
| 1936 | +1.8% |
| 1940 | −25.0% |
| 1944 | −31.3% |
| 1948 | −16.2% |
| 1952 | −46.4% |
| 1956 | −43.7% |
| 1960 | −34.9% |
| 1964 | +4.6% |
| 1968 | −31.3% |
| 1972 | −32.5% |
| 1976 | −24.8% |
| 1980 | −29.9% |
| 1984 | −34.7% |
| 1988 | −12.4% |
| 1992 | +2.2% |
| 1996 | −5.1% |
| 2000 | −13.8% |
| 2004 | −5.2% |
| 2008 | +9.7% |
| 2012 | +5.8% |
| 2016 | +4.9% |
| 2020 | +15.4% |
| 2024 | +17.6% |
| Year | Won | Margin | Democratic | Republican | Total |
|---|---|---|---|---|---|
| D | 129,376 | 89,680 | 225,654 | ||
| D | 126,117 | 91,488 | 224,333 | ||
| D | 93,113 | 83,430 | 195,981 | ||
| D | 92,747 | 82,376 | 180,180 | ||
| D | 89,822 | 73,641 | 166,373 | ||
| R | 68,266 | 75,884 | 146,436 | ||
| R | 46,055 | 62,429 | 118,537 | ||
| R | 40,965 | 45,935 | 97,450 | ||
| D | 38,232 | 35,995 | 99,660 | ||
| R | 35,703 | 45,967 | 83,066 | ||
| R | 23,896 | 49,883 | 74,848 | ||
| R | 17,072 | 36,240 | 64,129 | ||
| R | 19,005 | 32,169 | 52,983 | ||
| R | 13,731 | 27,462 | 42,234 | ||
| R | 9,152 | 18,438 | 29,676 | ||
| D | 12,776 | 11,636 | 24,585 | ||
| R | 7,550 | 15,671 | 23,255 | ||
| R | 5,612 | 14,364 | 20,015 | ||
| R | 5,266 | 14,484 | 19,860 | ||
| R | 7,062 | 9,813 | 17,029 | ||
| R | 5,172 | 9,914 | 15,144 | ||
| R | 6,402 | 10,720 | 17,248 | ||
| D | 7,521 | 7,243 | 15,221 | ||
| R | 6,494 | 7,040 | 14,118 | ||
| R | 3,203 | 8,213 | 11,578 | ||
| R | 1,970 | 6,538 | 9,809 | ||
| R | 2,708 | 5,487 | 8,528 | ||
| D | 4,868 | 2,797 | 8,183 | ||
| O | 2,597 | 1,932 | 7,161 | ||
| R | 3,629 | 4,489 | 8,786 | ||
| R | 2,070 | 4,138 | 6,606 | ||
| D | 2,456 | 2,343 | 5,111 | ||
| D | 3,195 | 734 | 4,053 | ||
| O | 0 | 975 | 2,265 | ||
| R | 769 | 1,322 | 2,267 | ||
| R | 644 | 1,038 | 1,922 | ||
| R | 388 | 646 | 1,213 | ||
| — | — | — | — |
Demographics
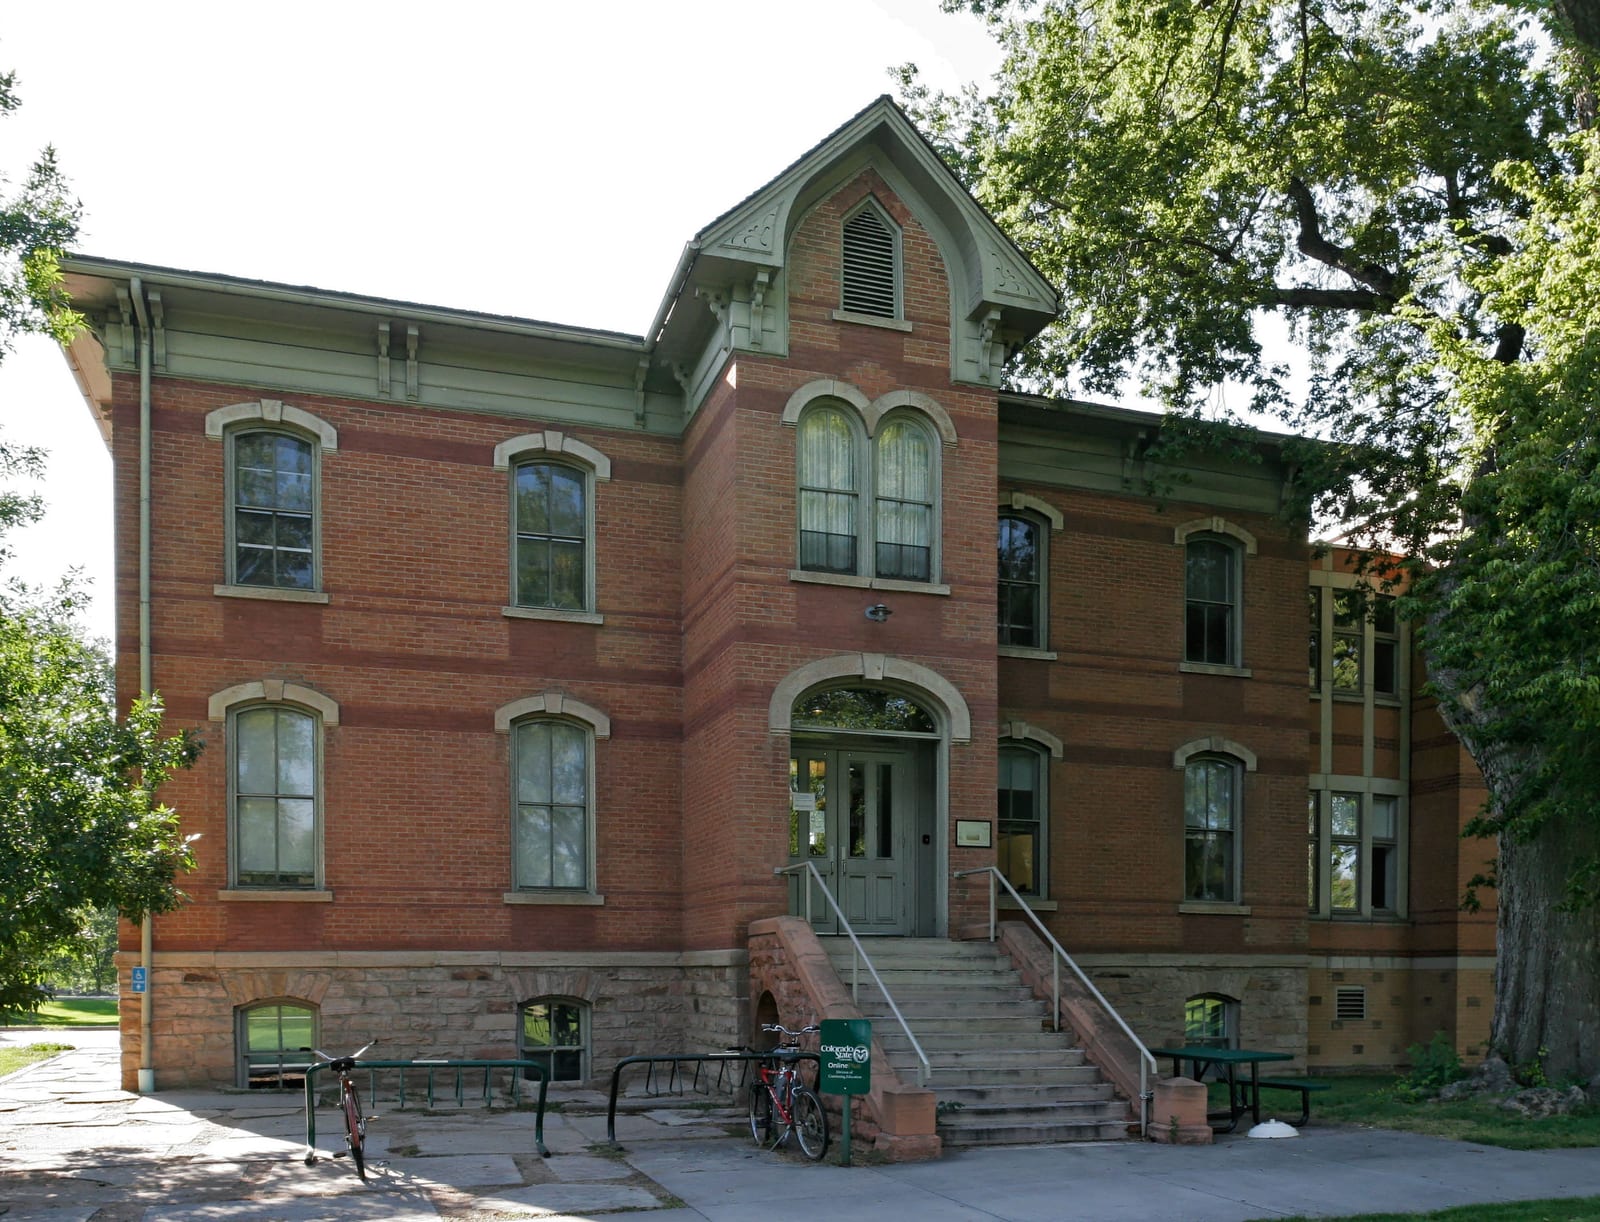
Home to Colorado State University, Larimer County has shifted noticeably leftward over two decades as its college-town core grew, yet surrounding rural and mountain communities keep the county's overall margin closer than its D+17.6 figure might suggest about the region.
Once reliably Republican — a margin of forty-seven points in 1924 at its widest — Larimer County has trended Democratic. Between 2020 and 2024 the county moved two points toward the Democratic candidate; the 2024 margin was eighteen points.
A median household income of $93,765 — among the higher at this geographic scale — and a population of 367,368 describe the county. The county's voting pattern over the last decade is most similar to that of Jefferson County and San Luis Obispo County.
Compare two places, side by side
Twelve curated comparisons line up election history, demographics, and the divergence story for two places at a glance. Browse all comparisons →
Larimer County, Colorado. Akashic. https://akashic.app/county/08069/. Accessed May 20, 2026. License: CC BY 4.0.