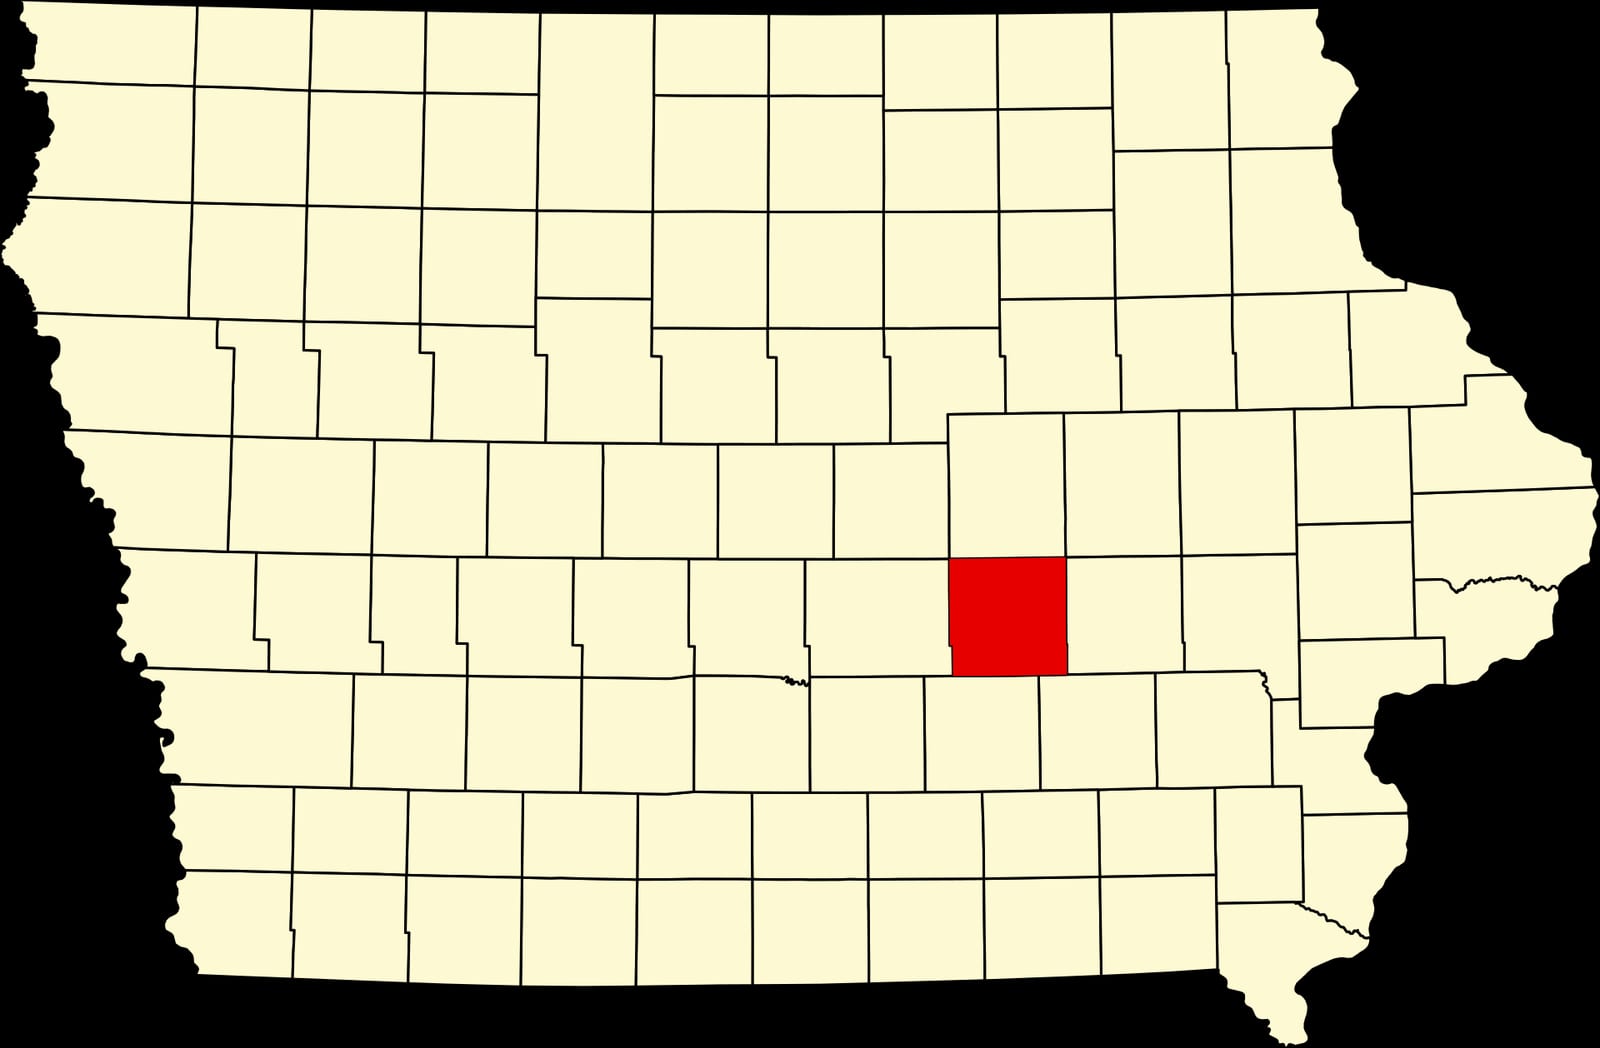
Poweshiek County, Iowa: Heartland Swing county. In 2024, voted R+17%. Republican peak: R+45 in 1920.
Key facts
- 2024 presidential margin
- R+17MIT Election Lab
- Political typology
- Heartland SwingAkashic typology
- Population
- 18,5452024 5-year
- Median household income
- $67,3912024 5-year
- White (non-Hispanic)
- 90.3%2024 5-year
- Black
- 1.0%2024 5-year
- Hispanic / Latino
- 3.5%2024 5-year
- Peak Democratic margin
- D+25 in 1964MIT Election Lab
- Peak Republican margin
- R+45 in 1920MIT Election Lab
- Most similar
- Marshall County, IA · similarity 0.98
| Donald Trump ✓Republican | 57.5% | 5,758 |
|---|---|---|
| Kamala HarrisDemocratic | 40.6% | 4,067 |
| OtherAll other candidates | 1.9% | 188 |
| Year | Margin (D minus R) |
|---|---|
| 1876 | No data |
| 1880 | No data |
| 1884 | No data |
| 1888 | No data |
| 1892 | −13.1% |
| 1896 | −18.8% |
| 1900 | −28.3% |
| 1904 | −41.4% |
| 1908 | −24.2% |
| 1912 | +16.0% |
| 1916 | −18.1% |
| 1920 | −45.3% |
| 1924 | −36.2% |
| 1928 | −29.8% |
| 1932 | +13.9% |
| 1936 | +7.9% |
| 1940 | +0.2% |
| 1944 | +0.6% |
| 1948 | +5.2% |
| 1952 | −29.3% |
| 1956 | −17.6% |
| 1960 | −17.5% |
| 1964 | +25.2% |
| 1968 | −15.0% |
| 1972 | −12.3% |
| 1976 | +1.9% |
| 1980 | −11.7% |
| 1984 | −6.9% |
| 1988 | +13.8% |
| 1992 | +9.0% |
| 1996 | +11.7% |
| 2000 | −1.9% |
| 2004 | +0.8% |
| 2008 | +11.8% |
| 2012 | +9.4% |
| 2016 | −6.5% |
| 2020 | −13.3% |
| 2024 | −16.9% |
| Year | Won | Margin | Democratic | Republican | Total |
|---|---|---|---|---|---|
| R | 4,067 | 5,758 | 10,013 | ||
| R | 4,306 | 5,657 | 10,140 | ||
| R | 4,304 | 4,946 | 9,916 | ||
| D | 5,357 | 4,424 | 9,975 | ||
| D | 5,519 | 4,340 | 10,031 | ||
| D | 5,043 | 4,965 | 10,091 | ||
| R | 4,222 | 4,396 | 8,980 | ||
| D | 4,183 | 3,221 | 8,214 | ||
| D | 4,056 | 3,245 | 9,047 | ||
| D | 4,876 | 3,683 | 8,625 | ||
| R | 4,103 | 4,715 | 8,889 | ||
| R | 3,529 | 4,598 | 9,102 | ||
| D | 4,360 | 4,194 | 8,735 | ||
| R | 3,718 | 4,785 | 8,648 | ||
| R | 3,250 | 4,470 | 8,112 | ||
| D | 5,213 | 3,109 | 8,334 | ||
| R | 3,671 | 5,232 | 8,904 | ||
| R | 3,602 | 5,145 | 8,749 | ||
| R | 3,318 | 6,105 | 9,498 | ||
| D | 4,324 | 3,888 | 8,385 | ||
| D | 4,234 | 4,186 | 8,461 | ||
| D | 4,794 | 4,773 | 9,611 | ||
| D | 4,745 | 4,037 | 8,996 | ||
| D | 4,649 | 3,490 | 8,355 | ||
| R | 2,787 | 5,212 | 8,150 | ||
| R | 1,428 | 4,414 | 8,239 | ||
| R | 2,125 | 5,806 | 8,130 | ||
| R | 1,880 | 2,748 | 4,788 | ||
| O | 1,631 | 902 | 4,545 | ||
| R | 1,661 | 2,794 | 4,678 | ||
| R | 1,212 | 3,137 | 4,649 | ||
| R | 1,765 | 3,199 | 5,074 | ||
| R | 2,013 | 2,969 | 5,076 | ||
| R | 1,776 | 2,359 | 4,447 | ||
| — | — | — | — | ||
| — | — | — | — | ||
| — | — | — | — | ||
| — | — | — | — |
Demographics
Poweshiek County anchors a liberal-arts institution with a national reputation inside a rural Iowa landscape that voted Republican by nearly 17 points in 2024, a gap that illustrates how college towns no longer reliably offset surrounding agricultural precincts.
The Democratic margin here peaked at twenty-five points in 1964. Between 2020 and 2024 the county moved four points toward the Republican candidate; the 2024 margin was seventeen points.
A population of 18,545, a 90% non-Hispanic-white share, and a median household income of $67,391 describe the county. The county's voting pattern over the last decade is most similar to that of Marshall County and Conejos County.
Compare two places, side by side
Twelve curated comparisons line up election history, demographics, and the divergence story for two places at a glance. Browse all comparisons →
Poweshiek County, Iowa. Akashic. https://akashic.app/county/19157/. Accessed May 20, 2026. License: CC BY 4.0.