Harford County, Maryland: Realigning Affluent Suburb county. In 2024, voted R+14%. Democratic peak: D+74 in 1912.
Key facts
- 2024 presidential margin
- R+14MIT Election Lab
- Political typology
- Realigning Affluent SuburbAkashic typology
- Population
- 263,7572024 5-year
- Median household income
- $112,2652024 5-year
- White (non-Hispanic)
- 73.0%2024 5-year
- Black
- 14.3%2024 5-year
- Hispanic / Latino
- 5.8%2024 5-year
- Peak Democratic margin
- D+74 in 1912MIT Election Lab
- Peak Republican margin
- R+48 in 1972MIT Election Lab
- Most similar
- Carroll County, MD · similarity 0.99
| Donald Trump ✓Republican | 55.3% | 83,050 |
|---|---|---|
| Kamala HarrisDemocratic | 41.6% | 62,453 |
| OtherAll other candidates | 3.1% | 4,587 |
| Year | Margin (D minus R) |
|---|---|
| 1876 | No data |
| 1880 | No data |
| 1884 | No data |
| 1888 | No data |
| 1892 | +14.3% |
| 1896 | −0.2% |
| 1900 | No data |
| 1904 | No data |
| 1908 | No data |
| 1912 | +74.1% |
| 1916 | +18.2% |
| 1920 | −0.5% |
| 1924 | +3.8% |
| 1928 | −29.6% |
| 1932 | +20.9% |
| 1936 | +7.3% |
| 1940 | −8.3% |
| 1944 | −16.5% |
| 1948 | −5.7% |
| 1952 | −22.4% |
| 1956 | −31.5% |
| 1960 | −13.1% |
| 1964 | +15.2% |
| 1968 | −19.2% |
| 1972 | −47.7% |
| 1976 | −10.0% |
| 1980 | −13.1% |
| 1984 | −37.1% |
| 1988 | −31.9% |
| 1992 | −11.4% |
| 1996 | −12.7% |
| 2000 | −18.8% |
| 2004 | −28.3% |
| 2008 | −18.8% |
| 2012 | −18.4% |
| 2016 | −23.4% |
| 2020 | −12.0% |
| 2024 | −13.7% |
| Year | Won | Margin | Democratic | Republican | Total |
|---|---|---|---|---|---|
| R | 62,453 | 83,050 | 150,090 | ||
| R | 63,095 | 80,930 | 148,186 | ||
| R | 47,077 | 77,860 | 131,596 | ||
| R | 49,729 | 72,911 | 125,954 | ||
| R | 48,552 | 71,751 | 123,295 | ||
| R | 39,685 | 71,565 | 112,728 | ||
| R | 35,665 | 52,862 | 91,424 | ||
| R | 29,779 | 39,686 | 78,191 | ||
| R | 27,164 | 36,350 | 80,687 | ||
| R | 19,803 | 38,493 | 58,566 | ||
| R | 17,133 | 37,382 | 54,642 | ||
| R | 20,042 | 26,713 | 50,941 | ||
| R | 19,890 | 24,309 | 44,199 | ||
| R | 8,737 | 25,141 | 34,366 | ||
| R | 9,914 | 15,799 | 30,691 | ||
| D | 13,550 | 9,968 | 23,518 | ||
| R | 9,293 | 12,090 | 21,383 | ||
| R | 6,588 | 12,657 | 19,245 | ||
| R | 6,809 | 10,770 | 17,659 | ||
| R | 5,494 | 6,168 | 11,750 | ||
| R | 4,839 | 6,751 | 11,590 | ||
| R | 5,500 | 6,501 | 12,060 | ||
| D | 6,165 | 5,327 | 11,531 | ||
| D | 6,073 | 3,954 | 10,134 | ||
| R | 3,506 | 6,479 | 10,040 | ||
| D | 3,841 | 3,545 | 7,758 | ||
| R | 4,134 | 4,175 | 8,374 | ||
| D | 3,345 | 2,302 | 5,732 | ||
| D | 5,972 | 1,737 | 5,713 | ||
| — | 5,833 | 3,148 | 82 | ||
| — | 6,924 | 2,561 | 121 | ||
| — | 3,509 | 3,145 | 20 | ||
| R | 3,360 | 3,374 | 7,105 | ||
| D | 3,309 | 2,449 | 6,022 | ||
| — | — | — | — | ||
| — | — | — | — | ||
| — | — | — | — | ||
| — | — | — | — |
Demographics
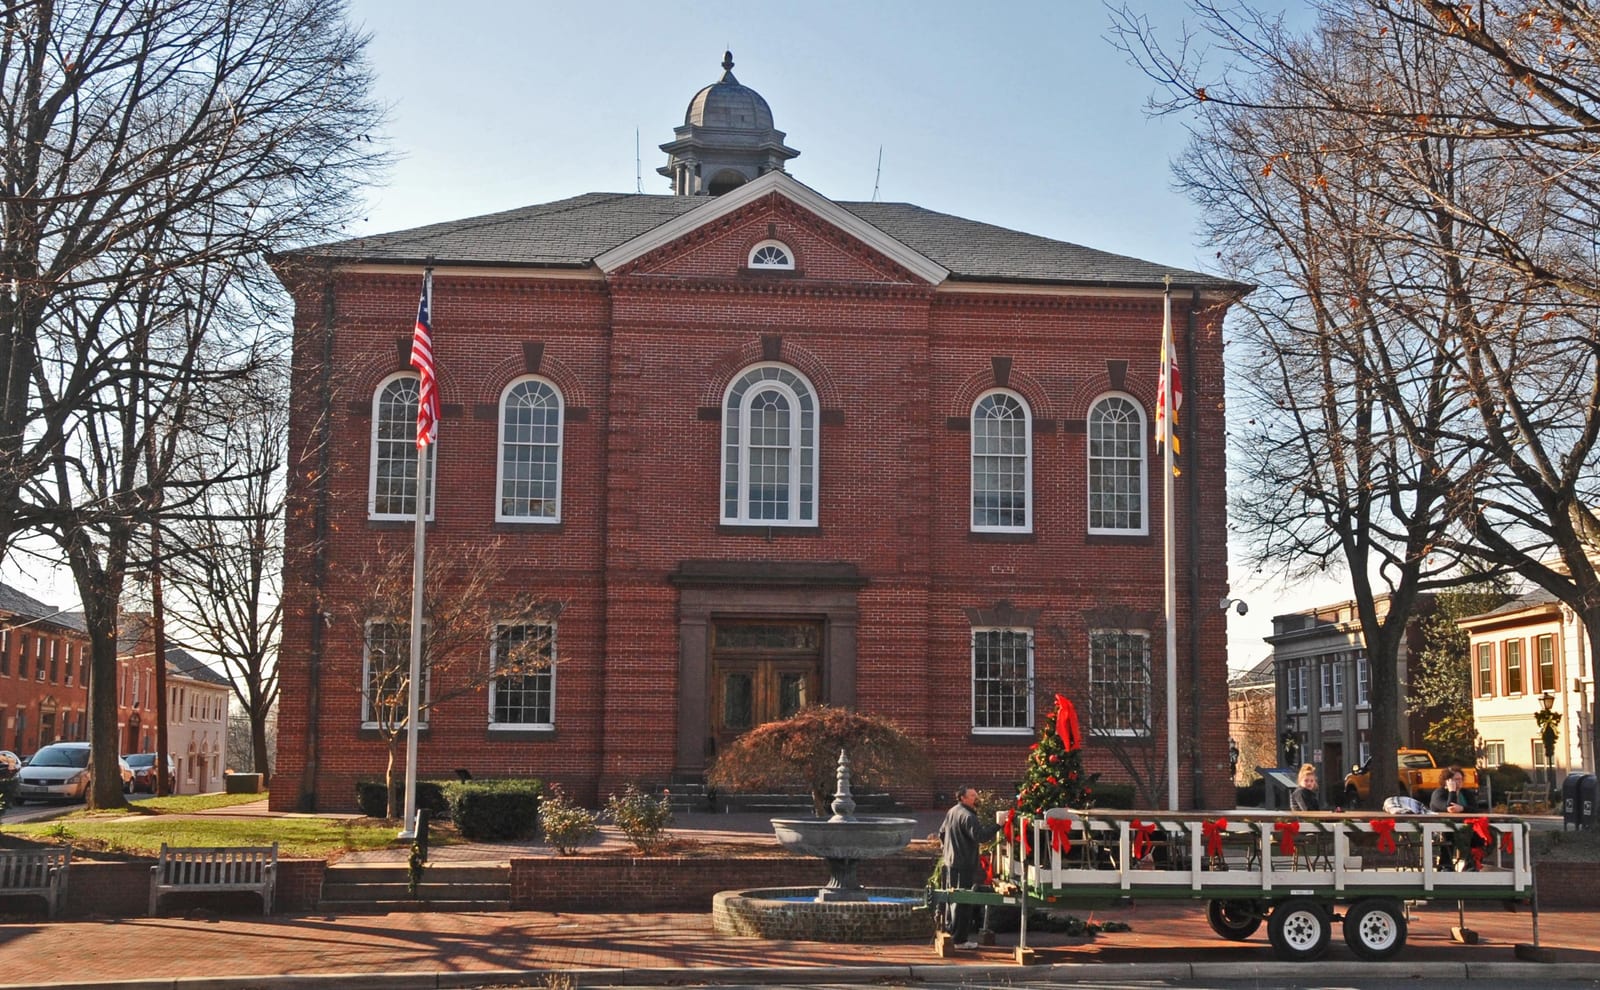
Harford County sits at the northeastern edge of the Baltimore metro, where lower-density development and a large military presence around Aberdeen Proving Ground have anchored consistently Republican margins in statewide and national contests.
Once reliably Republican — a margin of forty-eight points in 1972 at its widest — Harford County has trended Democratic. Between 2020 and 2024 the county moved two points toward the Republican candidate; the 2024 margin was fourteen points.
A median household income of $112,265 — among the higher at this geographic scale — and a population of 263,757 describe the county. The county's voting pattern over the last decade is most similar to that of Carroll County and Campbell County.
Compare two places, side by side
Twelve curated comparisons line up election history, demographics, and the divergence story for two places at a glance. Browse all comparisons →
Harford County, Maryland. Akashic. https://akashic.app/county/24025/. Accessed May 20, 2026. License: CC BY 4.0.