Callaway County, Missouri: Farm Belt county. In 2024, voted R+43%. Democratic peak: D+54 in 1932.
Key facts
- 2024 presidential margin
- R+43MIT Election Lab
- Political typology
- Farm BeltAkashic typology
- Population
- 44,7412024 5-year
- Median household income
- $74,1762024 5-year
- White (non-Hispanic)
- 88.4%2024 5-year
- Black
- 3.8%2024 5-year
- Hispanic / Latino
- 2.5%2024 5-year
- Peak Democratic margin
- D+54 in 1932MIT Election Lab
- Peak Republican margin
- R+43 in 2024MIT Election Lab
- Most similar
- Scott County, MO · similarity 1.00
| Donald Trump ✓Republican | 70.9% | 15,206 |
|---|---|---|
| Kamala HarrisDemocratic | 27.6% | 5,926 |
| OtherAll other candidates | 1.5% | 323 |
| Year | Margin (D minus R) |
|---|---|
| 1876 | No data |
| 1880 | No data |
| 1884 | No data |
| 1888 | No data |
| 1892 | +40.9% |
| 1896 | +40.0% |
| 1900 | +37.5% |
| 1904 | +33.5% |
| 1908 | +33.7% |
| 1912 | +37.4% |
| 1916 | +31.6% |
| 1920 | +29.6% |
| 1924 | +35.1% |
| 1928 | +22.3% |
| 1932 | +54.1% |
| 1936 | +39.3% |
| 1940 | +33.4% |
| 1944 | +29.3% |
| 1948 | +43.7% |
| 1952 | +17.9% |
| 1956 | +18.2% |
| 1960 | +13.7% |
| 1964 | +33.0% |
| 1968 | −5.8% |
| 1972 | −35.1% |
| 1976 | −2.7% |
| 1980 | −9.3% |
| 1984 | −31.3% |
| 1988 | −12.4% |
| 1992 | +6.6% |
| 1996 | +2.4% |
| 2000 | −10.0% |
| 2004 | −25.6% |
| 2008 | −19.7% |
| 2012 | −31.1% |
| 2016 | −41.7% |
| 2020 | −42.2% |
| 2024 | −43.3% |
| Year | Won | Margin | Democratic | Republican | Total |
|---|---|---|---|---|---|
| R | 5,926 | 15,206 | 21,455 | ||
| R | 5,870 | 14,815 | 21,183 | ||
| R | 4,989 | 13,057 | 19,333 | ||
| R | 6,071 | 11,745 | 18,232 | ||
| R | 7,580 | 11,389 | 19,321 | ||
| R | 6,559 | 11,108 | 17,773 | ||
| R | 6,708 | 8,238 | 15,308 | ||
| D | 5,880 | 5,567 | 13,137 | ||
| D | 5,799 | 4,880 | 13,981 | ||
| R | 5,209 | 6,687 | 11,938 | ||
| R | 4,327 | 8,262 | 12,589 | ||
| R | 5,560 | 6,755 | 12,835 | ||
| R | 4,843 | 5,115 | 10,059 | ||
| R | 3,036 | 6,313 | 9,349 | ||
| R | 3,738 | 4,277 | 9,291 | ||
| D | 5,916 | 2,983 | 8,899 | ||
| D | 5,344 | 4,054 | 9,398 | ||
| D | 5,165 | 3,572 | 8,737 | ||
| D | 5,484 | 3,818 | 9,321 | ||
| D | 6,215 | 2,433 | 8,658 | ||
| D | 5,757 | 3,143 | 8,924 | ||
| D | 7,162 | 3,574 | 10,757 | ||
| D | 7,160 | 3,112 | 10,293 | ||
| D | 7,042 | 2,079 | 9,172 | ||
| D | 5,153 | 3,269 | 8,437 | ||
| D | 5,904 | 2,799 | 8,836 | ||
| D | 6,035 | 3,274 | 9,339 | ||
| D | 3,882 | 2,009 | 5,919 | ||
| D | 3,544 | 1,525 | 5,402 | ||
| D | 3,878 | 1,911 | 5,845 | ||
| D | 3,596 | 1,765 | 5,466 | ||
| D | 4,133 | 1,864 | 6,053 | ||
| D | 4,358 | 1,849 | 6,278 | ||
| D | 3,620 | 1,453 | 5,296 | ||
| — | — | — | — | ||
| — | — | — | — | ||
| — | — | — | — | ||
| — | — | — | — |
Demographics
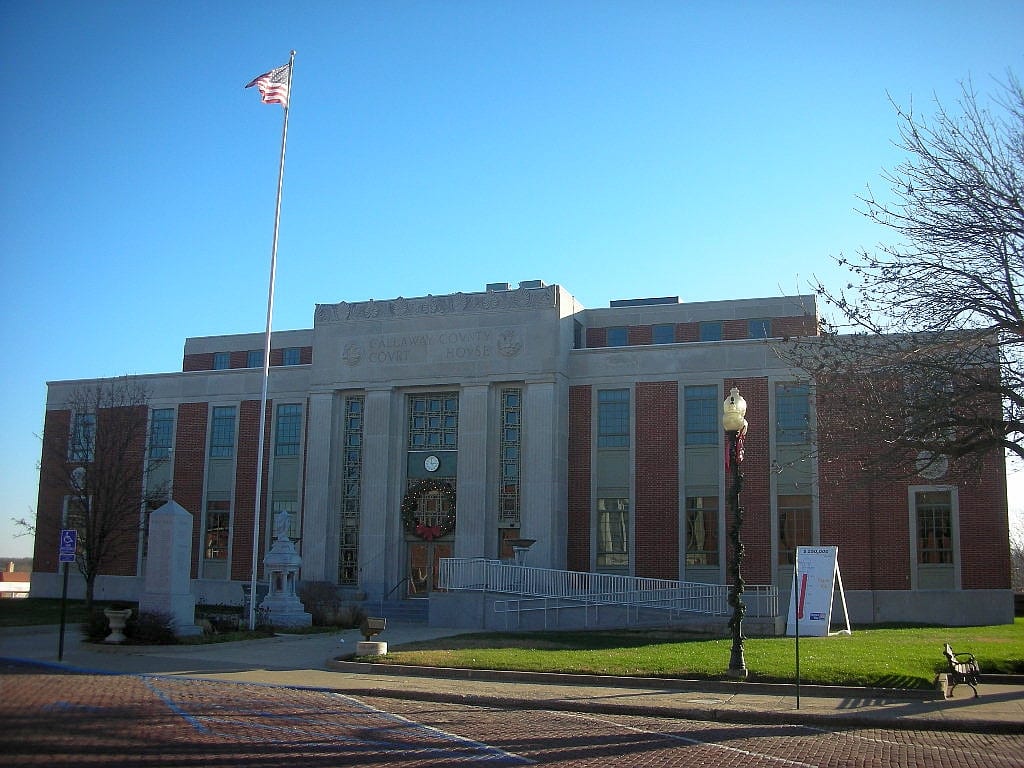
Callaway County, situated along the Missouri River northeast of Jefferson City, has shifted decisively toward Republican candidates over the past two decades, with 2024 margins reinforcing its status as one of the state's more reliably one-sided presidential battlegrounds.
The Republican margin here reached forty-three points in 2024. Between 2020 and 2024 the county moved one point toward the Republican candidate; the 2024 margin was forty-three points.
A population of 44,741, a 88% non-Hispanic-white share, and a median household income of $74,176 describe an agricultural county. The county's voting pattern over the last decade is most similar to that of Scott County and Crittenden County.
Compare two places, side by side
Twelve curated comparisons line up election history, demographics, and the divergence story for two places at a glance. Browse all comparisons →
Callaway County, Missouri. Akashic. https://akashic.app/county/29027/. Accessed May 20, 2026. License: CC BY 4.0.