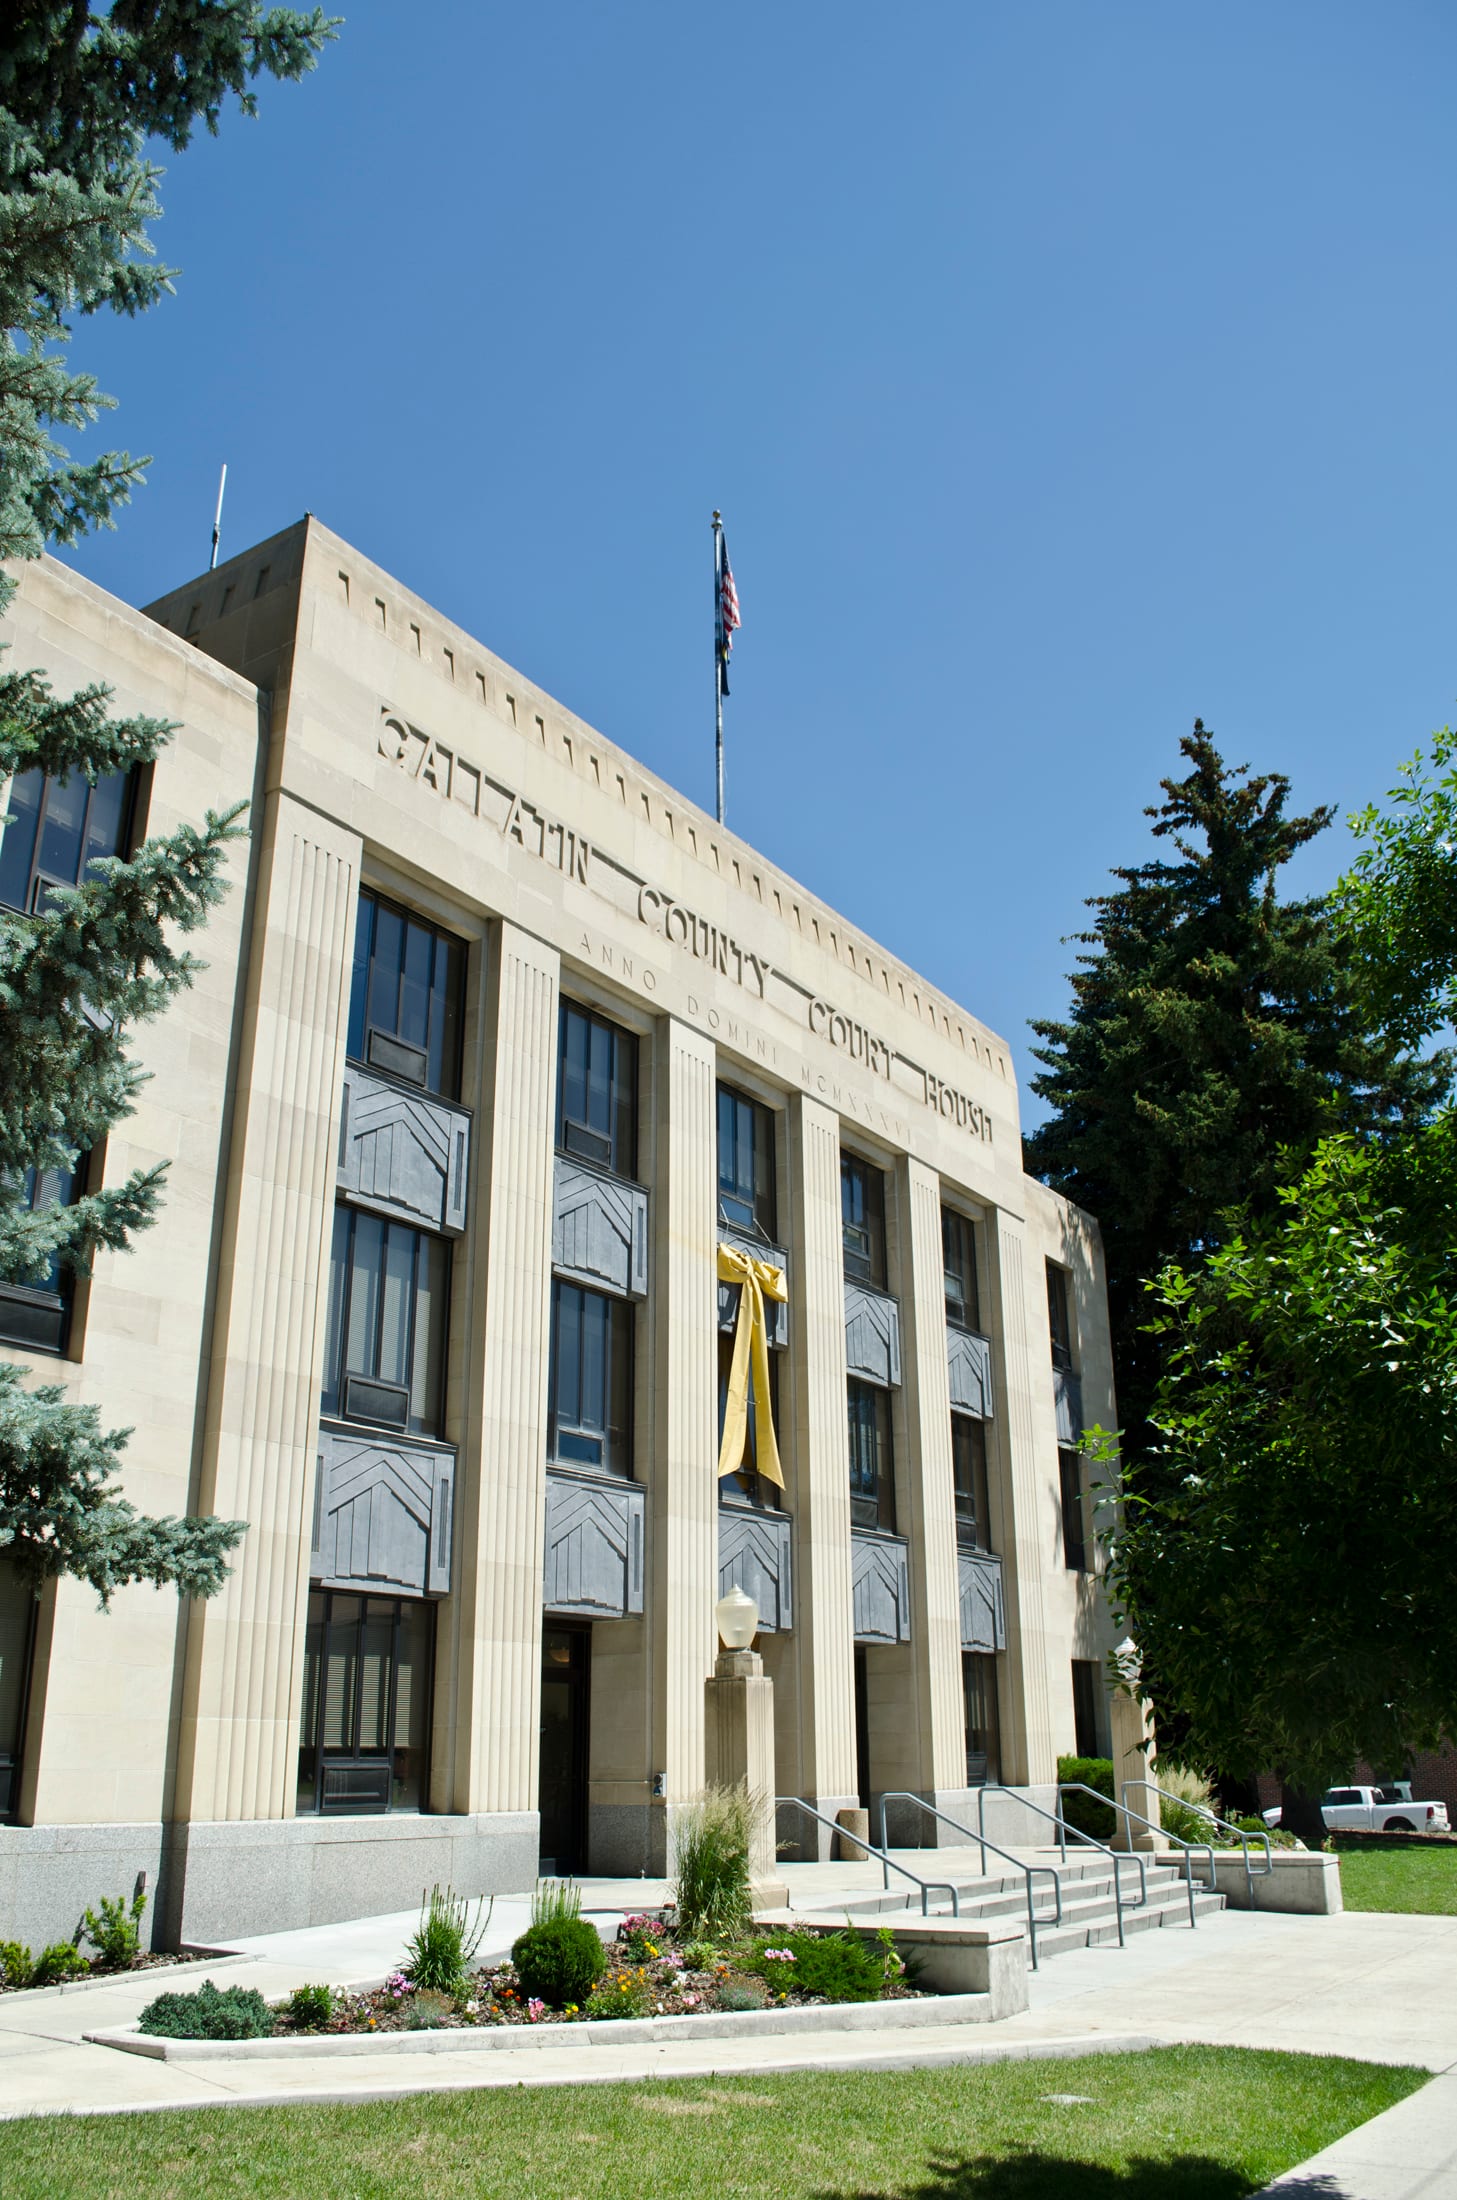
Gallatin County, Montana: Industrial Catholic Metro county. In 2024, voted D+3%. Democratic peak: D+58 in 1896.
Key facts
- 2024 presidential margin
- D+3MIT Election Lab
- Political typology
- Industrial Catholic MetroAkashic typology
- Population
- 124,0742024 5-year
- Median household income
- $93,5282024 5-year
- White (non-Hispanic)
- 88.8%2024 5-year
- Black
- 0.4%2024 5-year
- Hispanic / Latino
- 5.4%2024 5-year
- Peak Democratic margin
- D+58 in 1896MIT Election Lab
- Peak Republican margin
- R+44 in 1952MIT Election Lab
- Most similar
- Teton County, ID · similarity 0.98
| Kamala Harris ✓Democratic | 50.0% | 34,938 |
|---|---|---|
| Donald TrumpRepublican | 46.8% | 32,695 |
| OtherAll other candidates | 3.2% | 2,264 |
| Year | Margin (D minus R) |
|---|---|
| 1876 | No data |
| 1880 | No data |
| 1884 | No data |
| 1888 | No data |
| 1892 | +6.3% |
| 1896 | +58.2% |
| 1900 | +6.0% |
| 1904 | −18.7% |
| 1908 | −1.1% |
| 1912 | +22.3% |
| 1916 | +18.0% |
| 1920 | −14.7% |
| 1924 | −16.5% |
| 1928 | −22.8% |
| 1932 | +25.5% |
| 1936 | +35.5% |
| 1940 | +15.7% |
| 1944 | +5.4% |
| 1948 | −8.5% |
| 1952 | −44.2% |
| 1956 | −34.4% |
| 1960 | −29.2% |
| 1964 | −0.2% |
| 1968 | −30.2% |
| 1972 | −34.6% |
| 1976 | −27.8% |
| 1980 | −32.2% |
| 1984 | −31.0% |
| 1988 | −15.9% |
| 1992 | −5.5% |
| 1996 | −12.3% |
| 2000 | −27.5% |
| 2004 | −15.0% |
| 2008 | +3.4% |
| 2012 | −5.0% |
| 2016 | +0.8% |
| 2020 | +7.5% |
| 2024 | +3.2% |
| Year | Won | Margin | Democratic | Republican | Total |
|---|---|---|---|---|---|
| D | 34,938 | 32,695 | 69,897 | ||
| D | 37,044 | 31,696 | 70,979 | ||
| D | 24,246 | 23,802 | 53,819 | ||
| R | 21,961 | 24,358 | 47,908 | ||
| D | 24,205 | 22,578 | 48,155 | ||
| R | 16,405 | 22,392 | 39,842 | ||
| R | 10,009 | 18,833 | 32,040 | ||
| R | 10,972 | 14,559 | 29,078 | ||
| R | 9,535 | 11,109 | 28,779 | ||
| R | 9,527 | 13,214 | 23,205 | ||
| R | 8,163 | 15,643 | 24,140 | ||
| R | 5,747 | 12,738 | 21,726 | ||
| R | 6,215 | 11,062 | 17,460 | ||
| R | 5,096 | 10,663 | 16,088 | ||
| R | 3,818 | 7,433 | 11,978 | ||
| R | 5,600 | 5,621 | 11,248 | ||
| R | 3,761 | 6,870 | 10,652 | ||
| R | 3,260 | 6,680 | 9,940 | ||
| R | 2,697 | 6,998 | 9,729 | ||
| R | 3,548 | 4,220 | 7,950 | ||
| D | 3,479 | 3,120 | 6,632 | ||
| D | 4,718 | 3,430 | 8,198 | ||
| D | 4,697 | 2,151 | 7,168 | ||
| D | 4,359 | 2,553 | 7,095 | ||
| R | 2,423 | 3,861 | 6,318 | ||
| R | 1,564 | 2,494 | 5,623 | ||
| R | 2,370 | 3,238 | 5,920 | ||
| D | 3,661 | 2,527 | 6,306 | ||
| D | 1,407 | 683 | 3,241 | ||
| R | 1,485 | 1,519 | 3,219 | ||
| R | 1,130 | 1,700 | 3,048 | ||
| D | 1,297 | 1,146 | 2,517 | ||
| D | 1,649 | 423 | 2,108 | ||
| D | 1,144 | 998 | 2,304 | ||
| — | — | — | — | ||
| — | — | — | — | ||
| — | — | — | — | ||
| — | — | — | — |
Demographics
Gallatin County's political center of gravity has tracked its rapid population growth around Bozeman, flipping from reliably Republican to a narrow Democratic lean in presidential contests over the past decade.
Its margins are typically close. The Democratic margin reached fifty-eight points in 1896; the Republican margin reached forty-four points in 1952. Between 2020 and 2024 the county moved four points toward the Republican candidate; the 2024 margin was three points.
Its demographics sit near national norms: a 89% non-Hispanic-white share, a median household income of $93,528, and a 10% poverty rate. The county's voting pattern over the last decade is most similar to that of Teton County and Leelanau County.
Compare two places, side by side
Twelve curated comparisons line up election history, demographics, and the divergence story for two places at a glance. Browse all comparisons →
Gallatin County, Montana. Akashic. https://akashic.app/county/30031/. Accessed May 20, 2026. License: CC BY 4.0.