Carson City, Nevada: Diversifying Metro county. In 2024, voted R+11%. Republican peak: R+48 in 1952.
Key facts
- 2024 presidential margin
- R+11MIT Election Lab
- Political typology
- Diversifying MetroAkashic typology
- Population
- 58,3842024 5-year
- Median household income
- $72,3552024 5-year
- White (non-Hispanic)
- 67.9%2024 5-year
- Black
- 1.8%2024 5-year
- Hispanic / Latino
- 26.4%2024 5-year
- Peak Democratic margin
- D+33 in 1896MIT Election Lab
- Peak Republican margin
- R+48 in 1952MIT Election Lab
- Most similar
- Clinton County, MI · similarity 0.99
| Donald Trump ✓Republican | 54.3% | 16,873 |
|---|---|---|
| Kamala HarrisDemocratic | 43.1% | 13,375 |
| OtherAll other candidates | 2.6% | 820 |
| Year | Margin (D minus R) |
|---|---|
| 1876 | No data |
| 1880 | No data |
| 1884 | No data |
| 1888 | No data |
| 1892 | −44.8% |
| 1896 | +33.2% |
| 1900 | +12.4% |
| 1904 | −28.1% |
| 1908 | −0.9% |
| 1912 | +21.3% |
| 1916 | +6.2% |
| 1920 | −17.5% |
| 1924 | +0.2% |
| 1928 | −16.1% |
| 1932 | +8.7% |
| 1936 | +16.6% |
| 1940 | +2.4% |
| 1944 | −11.7% |
| 1948 | −23.0% |
| 1952 | −48.1% |
| 1956 | −36.1% |
| 1960 | −20.5% |
| 1964 | +3.2% |
| 1968 | −25.0% |
| 1972 | −43.6% |
| 1976 | −14.4% |
| 1980 | −44.8% |
| 1984 | −42.0% |
| 1988 | −30.2% |
| 1992 | −6.7% |
| 1996 | −10.1% |
| 2000 | −19.2% |
| 2004 | −16.1% |
| 2008 | +0.9% |
| 2012 | −9.0% |
| 2016 | −14.1% |
| 2020 | −11.4% |
| 2024 | −11.3% |
| Year | Won | Margin | Democratic | Republican | Total |
|---|---|---|---|---|---|
| R | 13,375 | 16,873 | 31,068 | ||
| R | 12,735 | 16,113 | 29,739 | ||
| R | 9,610 | 13,125 | 25,016 | ||
| R | 10,291 | 12,394 | 23,319 | ||
| D | 11,623 | 11,419 | 23,463 | ||
| R | 9,441 | 13,171 | 23,106 | ||
| R | 7,354 | 11,084 | 19,452 | ||
| R | 7,269 | 9,168 | 18,814 | ||
| R | 6,035 | 7,302 | 18,803 | ||
| R | 5,088 | 9,701 | 15,291 | ||
| R | 3,790 | 9,477 | 13,536 | ||
| R | 2,769 | 8,389 | 12,556 | ||
| R | 3,874 | 5,282 | 9,761 | ||
| R | 2,120 | 5,396 | 7,516 | ||
| R | 1,770 | 3,169 | 5,601 | ||
| D | 2,129 | 1,997 | 4,126 | ||
| R | 1,283 | 1,946 | 3,229 | ||
| R | 822 | 1,749 | 2,571 | ||
| R | 579 | 1,653 | 2,232 | ||
| R | 681 | 1,095 | 1,801 | ||
| R | 665 | 841 | 1,506 | ||
| D | 785 | 748 | 1,533 | ||
| D | 745 | 533 | 1,278 | ||
| D | 579 | 486 | 1,065 | ||
| R | 426 | 590 | 1,016 | ||
| D | 415 | 413 | 932 | ||
| R | 413 | 592 | 1,024 | ||
| D | 610 | 534 | 1,227 | ||
| D | 294 | 150 | 675 | ||
| R | 343 | 350 | 751 | ||
| R | 218 | 409 | 680 | ||
| D | 399 | 311 | 710 | ||
| D | 566 | 284 | 850 | ||
| R | 31 | 417 | 862 | ||
| — | — | — | — | ||
| — | — | — | — | ||
| — | — | — | — | ||
| — | — | — | — |
Demographics
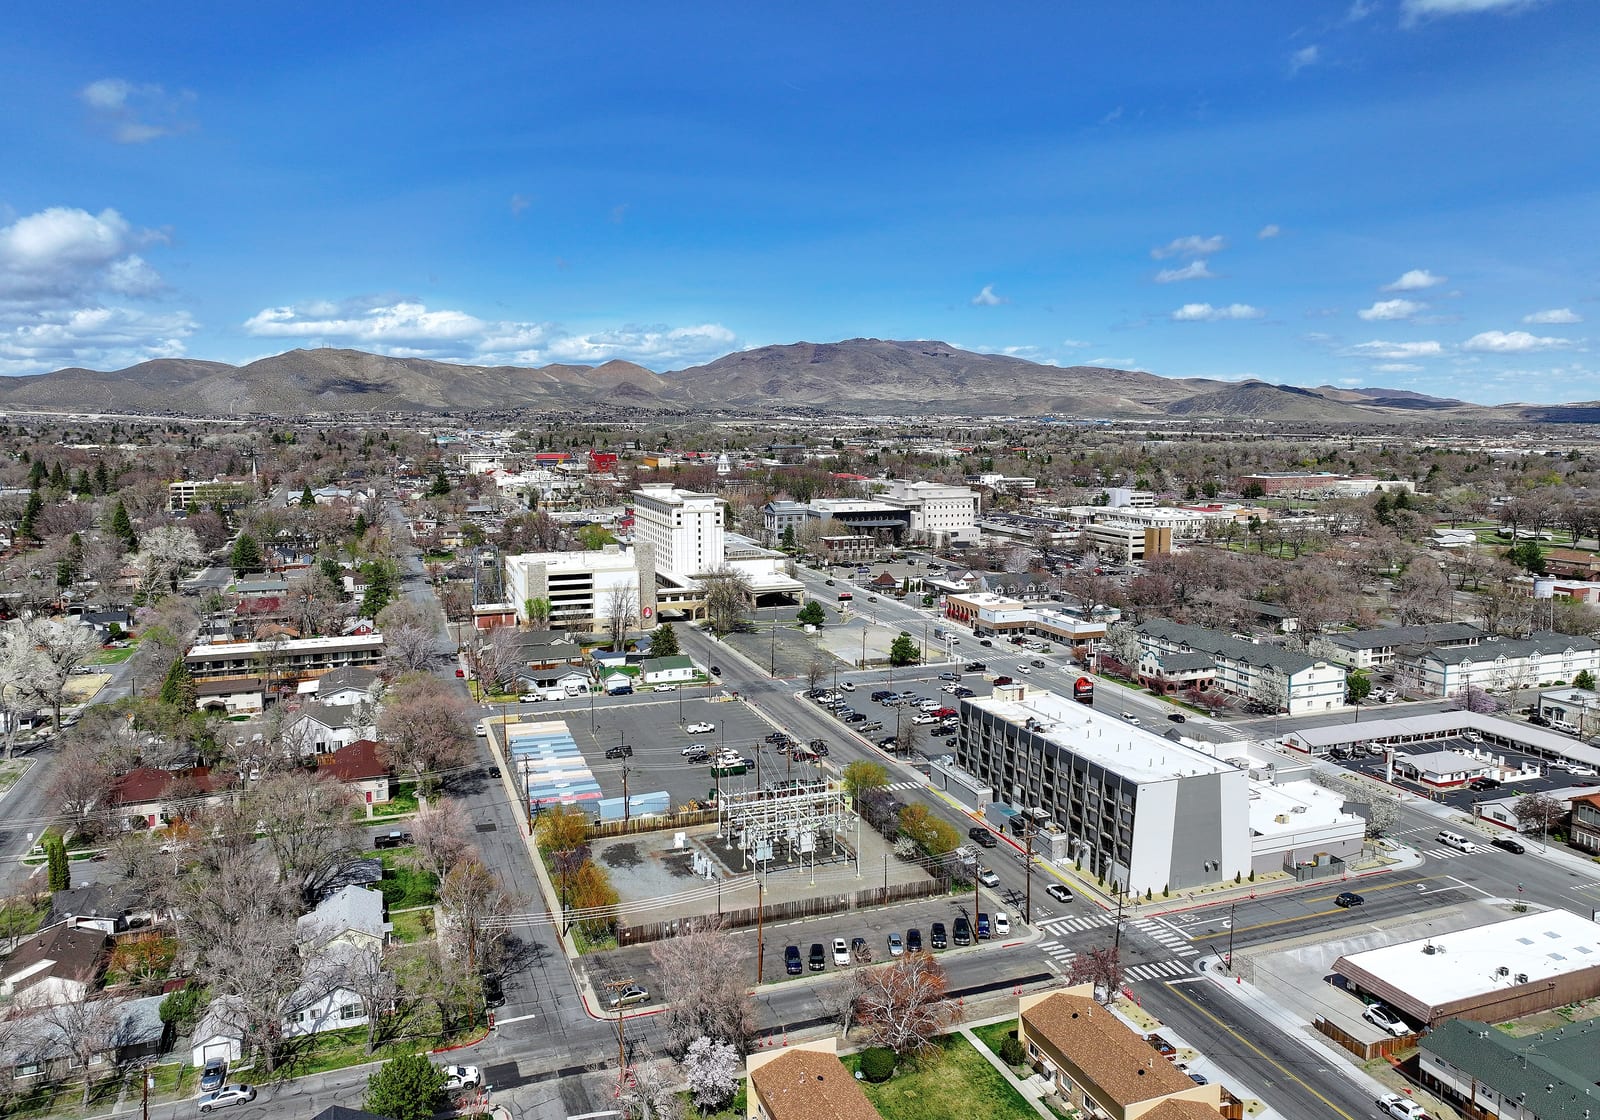
Carson City functions as both an independent city and county, making it Nevada's only consolidated municipality of that type. Despite housing state government, it has trended Republican in recent cycles, posting an R+11.3 margin in 2024.
The Democratic margin here reached thirty-three points in 1896. The 2024 margin was eleven points.
A population of 58,384, a 68% non-Hispanic-white share, and a median household income of $72,355 describe the county. The county's voting pattern over the last decade is most similar to that of Clinton County and Berrien County.
Compare two places, side by side
Twelve curated comparisons line up election history, demographics, and the divergence story for two places at a glance. Browse all comparisons →
Carson City, Nevada. Akashic. https://akashic.app/county/32510/. Accessed May 20, 2026. License: CC BY 4.0.