Grafton County, New Hampshire: Industrial Catholic Metro county. In 2024, voted D+20%. Republican peak: R+48 in 1956.
Key facts
- 2024 presidential margin
- D+20MIT Election Lab
- Political typology
- Industrial Catholic MetroAkashic typology
- Population
- 92,1202024 5-year
- Median household income
- $88,2612024 5-year
- White (non-Hispanic)
- 88.3%2024 5-year
- Black
- 1.1%2024 5-year
- Hispanic / Latino
- 2.9%2024 5-year
- Peak Democratic margin
- D+28 in 2008MIT Election Lab
- Peak Republican margin
- R+48 in 1956MIT Election Lab
- Most similar
- Knox County, ME · similarity 0.99
| Kamala Harris ✓Democratic | 59.0% | 32,995 |
|---|---|---|
| Donald TrumpRepublican | 39.2% | 21,910 |
| OtherAll other candidates | 1.8% | 993 |
| Year | Margin (D minus R) |
|---|---|
| 1876 | No data |
| 1880 | No data |
| 1884 | No data |
| 1888 | No data |
| 1892 | −0.3% |
| 1896 | −42.8% |
| 1900 | −25.6% |
| 1904 | −26.7% |
| 1908 | −27.1% |
| 1912 | +2.4% |
| 1916 | −1.6% |
| 1920 | −22.5% |
| 1924 | −31.4% |
| 1928 | −34.8% |
| 1932 | −12.8% |
| 1936 | −14.1% |
| 1940 | −8.1% |
| 1944 | −11.2% |
| 1948 | −28.0% |
| 1952 | −44.5% |
| 1956 | −48.1% |
| 1960 | −29.8% |
| 1964 | +19.5% |
| 1968 | −23.5% |
| 1972 | −32.5% |
| 1976 | −22.7% |
| 1980 | −29.4% |
| 1984 | −35.5% |
| 1988 | −24.6% |
| 1992 | +5.3% |
| 1996 | +16.2% |
| 2000 | +0.6% |
| 2004 | +12.6% |
| 2008 | +27.7% |
| 2012 | +23.7% |
| 2016 | +18.6% |
| 2020 | +24.5% |
| 2024 | +19.8% |
| Year | Won | Margin | Democratic | Republican | Total |
|---|---|---|---|---|---|
| D | 32,995 | 21,910 | 55,898 | ||
| D | 33,180 | 19,905 | 54,132 | ||
| D | 28,510 | 19,010 | 51,191 | ||
| D | 29,826 | 18,208 | 49,014 | ||
| D | 31,446 | 17,687 | 49,602 | ||
| D | 26,180 | 20,277 | 46,971 | ||
| D | 18,326 | 18,092 | 38,733 | ||
| D | 19,496 | 13,543 | 36,792 | ||
| D | 15,389 | 13,450 | 36,343 | ||
| R | 11,484 | 19,033 | 30,699 | ||
| R | 8,757 | 18,451 | 27,300 | ||
| R | 7,282 | 15,273 | 27,151 | ||
| R | 8,996 | 14,430 | 23,914 | ||
| R | 8,388 | 16,605 | 25,319 | ||
| R | 7,813 | 12,881 | 21,554 | ||
| D | 12,566 | 8,461 | 21,027 | ||
| R | 7,821 | 14,454 | 22,275 | ||
| R | 5,466 | 15,609 | 21,081 | ||
| R | 6,124 | 15,937 | 22,061 | ||
| R | 6,841 | 12,248 | 19,281 | ||
| R | 8,743 | 10,947 | 19,697 | ||
| R | 9,761 | 11,478 | 21,239 | ||
| R | 8,520 | 11,336 | 20,016 | ||
| R | 8,342 | 10,810 | 19,323 | ||
| R | 6,035 | 12,566 | 18,759 | ||
| R | 5,360 | 10,493 | 16,364 | ||
| R | 6,102 | 9,650 | 15,794 | ||
| R | 4,644 | 4,795 | 9,517 | ||
| D | 3,752 | 3,520 | 9,590 | ||
| R | 3,582 | 6,323 | 10,101 | ||
| R | 3,496 | 6,100 | 9,752 | ||
| R | 3,619 | 6,177 | 10,010 | ||
| R | 2,306 | 6,199 | 9,096 | ||
| R | 4,794 | 4,828 | 9,804 | ||
| — | — | — | — | ||
| — | — | — | — | ||
| — | — | — | — | ||
| — | — | — | — |
Demographics
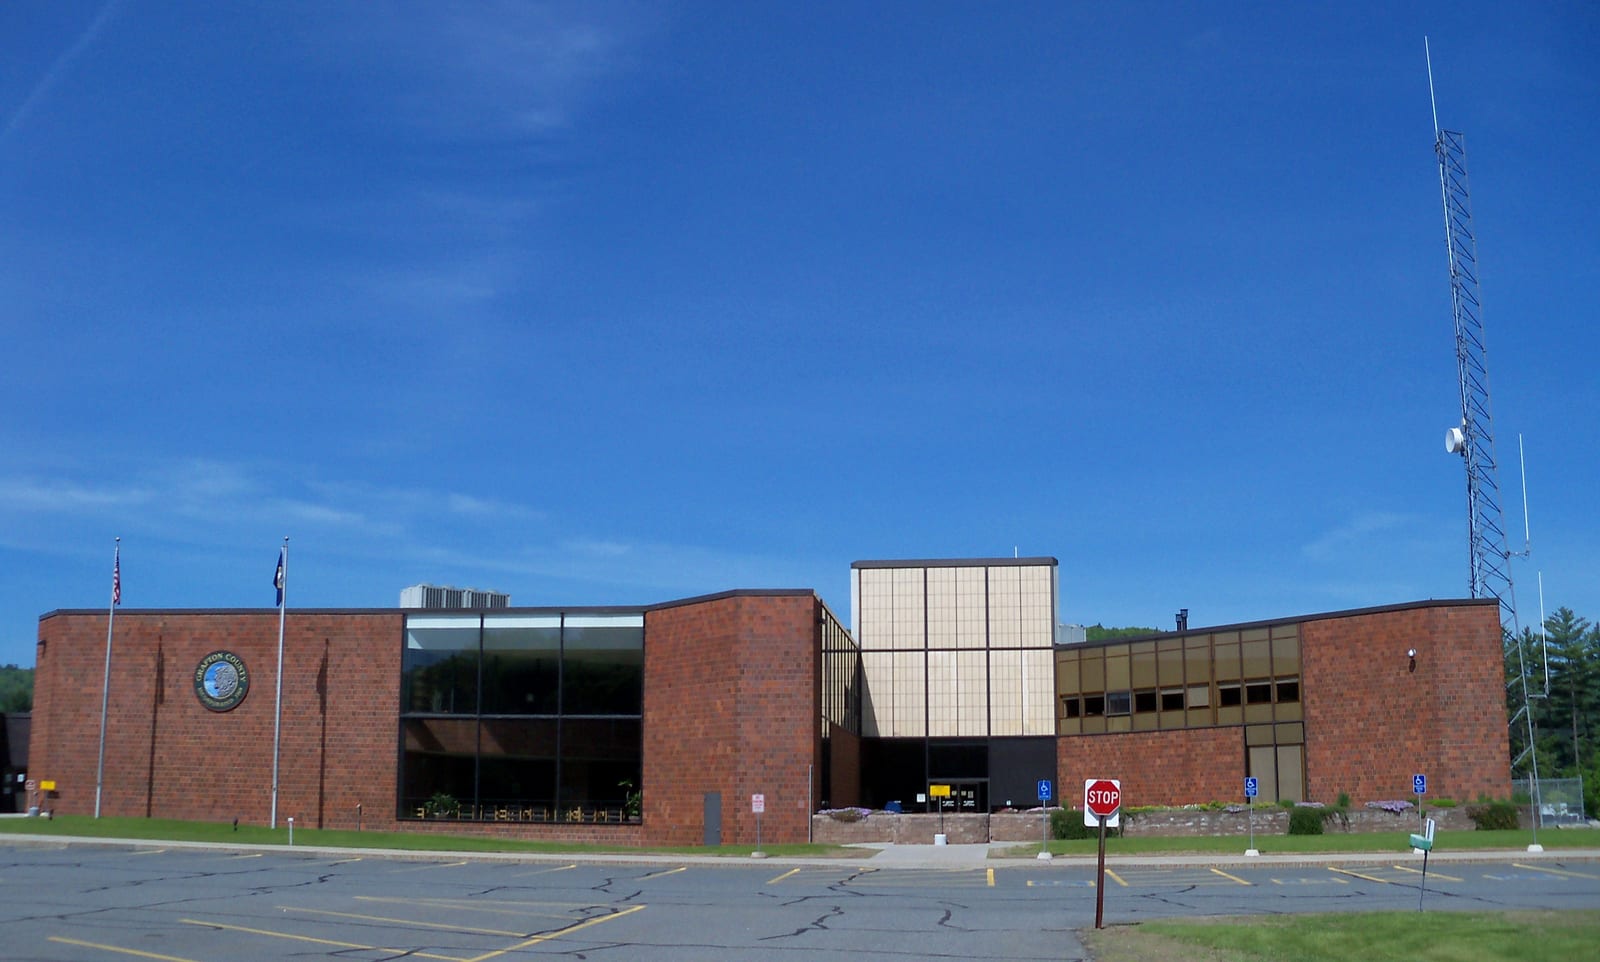
Grafton County's tilt toward Democrats is anchored by the Dartmouth College community in Hanover, while its rural towns and White Mountain terrain produce a more varied electorate than the topline margin suggests.
Its margins are typically close. The Democratic margin reached twenty-eight points in 2008; the Republican margin reached forty-eight points in 1956. Between 2020 and 2024 the county moved five points toward the Republican candidate; the 2024 margin was twenty points.
Its demographics sit near national norms: a 88% non-Hispanic-white share, a median household income of $88,261, and a 10% poverty rate. The county's voting pattern over the last decade is most similar to that of Knox County and Ulster County.
Compare two places, side by side
Twelve curated comparisons line up election history, demographics, and the divergence story for two places at a glance. Browse all comparisons →
Grafton County, New Hampshire. Akashic. https://akashic.app/county/33009/. Accessed May 20, 2026. License: CC BY 4.0.