Socorro County, New Mexico: New American county. In 2024, voted R+4%. Republican peak: R+29 in 1924.
Key facts
- 2024 presidential margin
- R+4MIT Election Lab
- Political typology
- New AmericanAkashic typology
- Population
- 16,2002024 5-year
- Median household income
- $36,5702024 5-year
- White (non-Hispanic)
- 42.2%2024 5-year
- Black
- 0.4%2024 5-year
- Hispanic / Latino
- 50.3%2024 5-year
- Peak Democratic margin
- D+21 in 2008MIT Election Lab
- Peak Republican margin
- R+29 in 1924MIT Election Lab
- Most similar
- Sussex County, VA · similarity 0.95
| Donald Trump ✓Republican | 50.5% | 3,651 |
|---|---|---|
| Kamala HarrisDemocratic | 46.8% | 3,384 |
| OtherAll other candidates | 2.7% | 198 |
| Year | Margin (D minus R) |
|---|---|
| 1876 | No data |
| 1880 | No data |
| 1884 | No data |
| 1888 | No data |
| 1892 | No data |
| 1896 | No data |
| 1900 | No data |
| 1904 | No data |
| 1908 | No data |
| 1912 | +5.1% |
| 1916 | −11.2% |
| 1920 | −26.9% |
| 1924 | −28.9% |
| 1928 | −10.7% |
| 1932 | +12.7% |
| 1936 | −1.1% |
| 1940 | −4.1% |
| 1944 | −1.6% |
| 1948 | −12.9% |
| 1952 | −11.2% |
| 1956 | −23.1% |
| 1960 | +12.9% |
| 1964 | +14.9% |
| 1968 | −8.4% |
| 1972 | −14.0% |
| 1976 | +6.9% |
| 1980 | −8.5% |
| 1984 | −14.3% |
| 1988 | −2.5% |
| 1992 | +11.9% |
| 1996 | +16.6% |
| 2000 | +1.8% |
| 2004 | +4.2% |
| 2008 | +21.1% |
| 2012 | +18.6% |
| 2016 | +10.1% |
| 2020 | +6.5% |
| 2024 | −3.7% |
| Year | Won | Margin | Democratic | Republican | Total |
|---|---|---|---|---|---|
| R | 3,384 | 3,651 | 7,233 | ||
| D | 3,722 | 3,255 | 7,160 | ||
| D | 3,313 | 2,616 | 6,868 | ||
| D | 4,058 | 2,722 | 7,193 | ||
| D | 4,696 | 3,032 | 7,895 | ||
| D | 4,025 | 3,696 | 7,851 | ||
| D | 3,294 | 3,173 | 6,826 | ||
| D | 3,374 | 2,315 | 6,364 | ||
| D | 2,908 | 2,186 | 6,088 | ||
| R | 2,960 | 3,114 | 6,217 | ||
| R | 2,541 | 3,403 | 6,048 | ||
| R | 2,226 | 2,685 | 5,422 | ||
| D | 2,606 | 2,265 | 4,939 | ||
| R | 1,994 | 2,658 | 4,730 | ||
| R | 1,871 | 2,230 | 4,283 | ||
| D | 2,397 | 1,774 | 4,181 | ||
| D | 2,327 | 1,796 | 4,128 | ||
| R | 1,476 | 2,365 | 3,841 | ||
| R | 1,777 | 2,224 | 4,006 | ||
| R | 1,650 | 2,139 | 3,798 | ||
| R | 1,967 | 2,030 | 4,000 | ||
| R | 2,489 | 2,703 | 5,197 | ||
| R | 2,477 | 2,530 | 5,023 | ||
| D | 2,495 | 1,931 | 4,438 | ||
| R | 1,564 | 1,940 | 3,507 | ||
| R | 1,251 | 2,332 | 3,742 | ||
| R | 1,807 | 3,150 | 4,987 | ||
| R | 1,558 | 1,954 | 3,534 | ||
| D | 1,078 | 960 | 2,327 | ||
| — | — | — | — | ||
| — | — | — | — | ||
| — | — | — | — | ||
| — | — | — | — | ||
| — | — | — | — | ||
| — | — | — | — | ||
| — | — | — | — | ||
| — | — | — | — | ||
| — | — | — | — |
Demographics
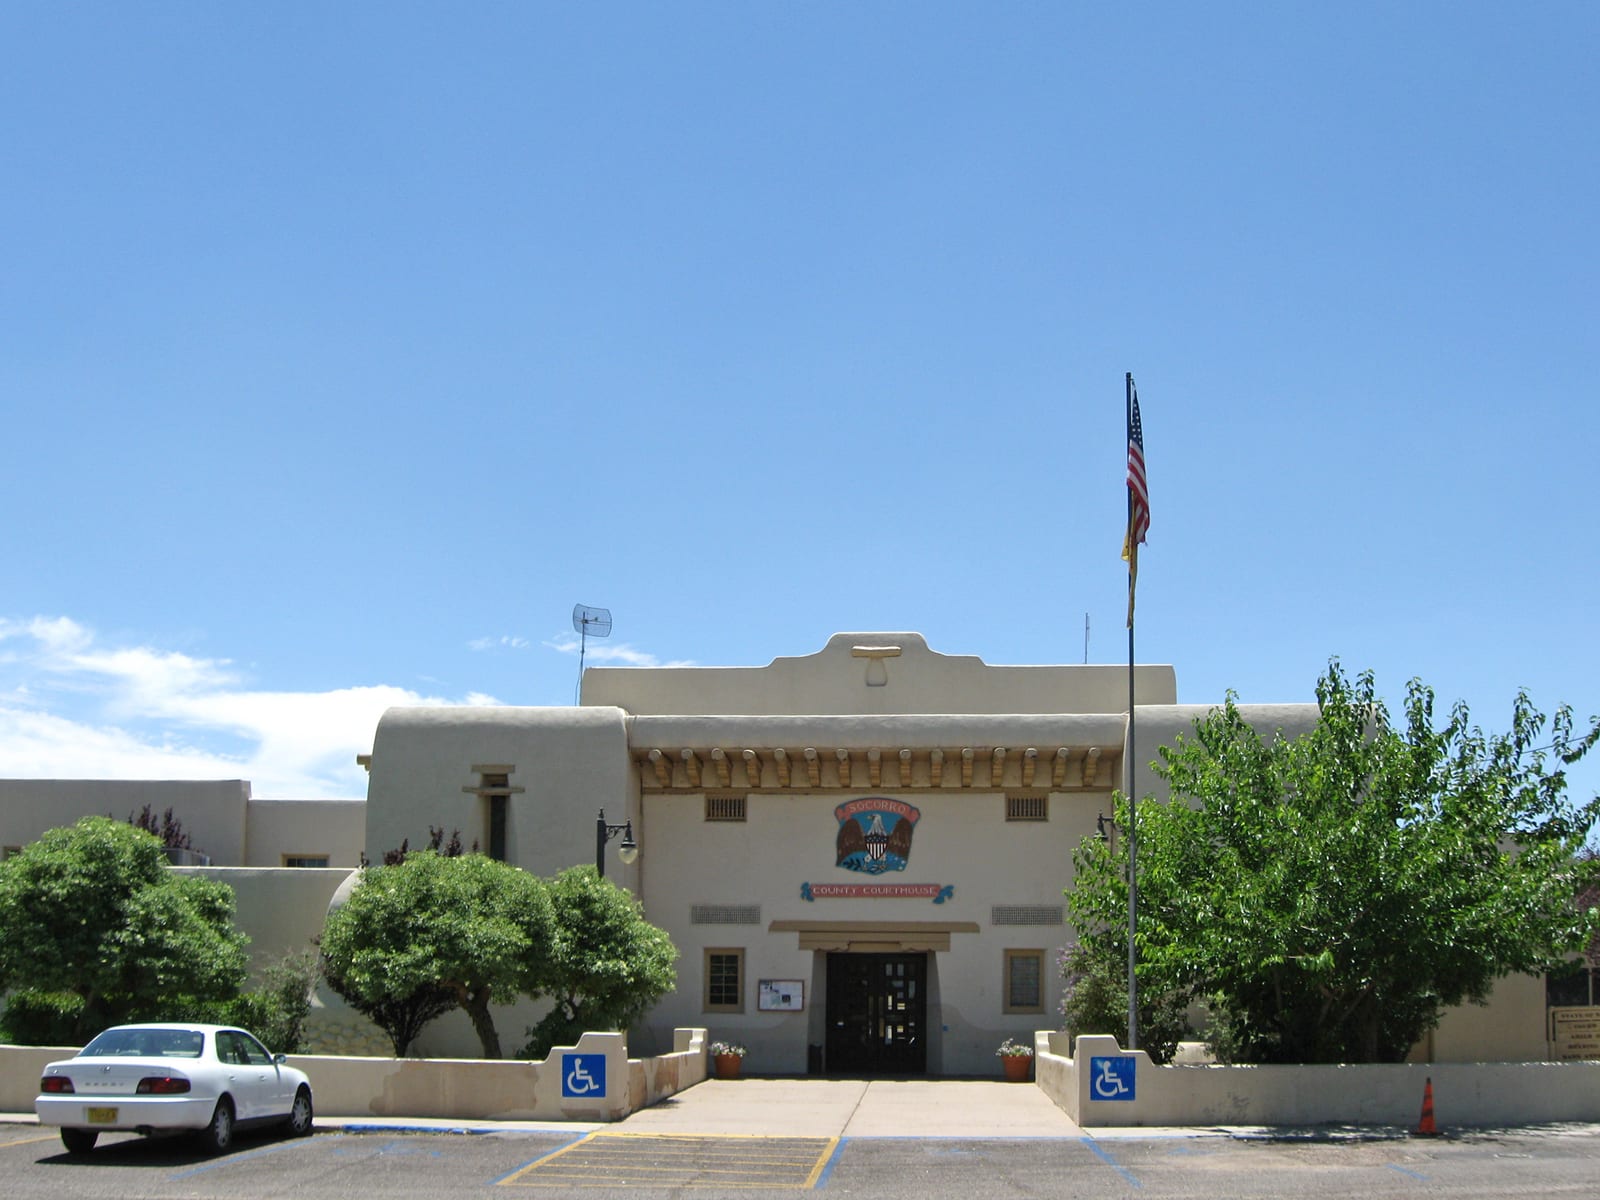
Socorro County, anchored by the city of Socorro and New Mexico Tech, shifted to the Republican column by 3.7 points in 2024 after voting Democratic in prior presidential cycles — a swing reflecting broader rural realignment in the state's Hispanic-majority counties.
Socorro County has leaned Republican in recent presidential elections, reaching a Democratic margin of twenty-one points in 2008. Between 2020 and 2024 it moved ten points toward the Republican candidate — part of the sharpest rightward shift recorded among any group of places in the country.
Its demographics describe the shift: a 42% non-Hispanic-white share, a median household income of $36,570, and a population of 16,200. The county's voting pattern over the last decade is most similar to that of Sussex County and Franklin County.
Compare two places, side by side
Twelve curated comparisons line up election history, demographics, and the divergence story for two places at a glance. Browse all comparisons →
Socorro County, New Mexico. Akashic. https://akashic.app/county/35053/. Accessed May 20, 2026. License: CC BY 4.0.