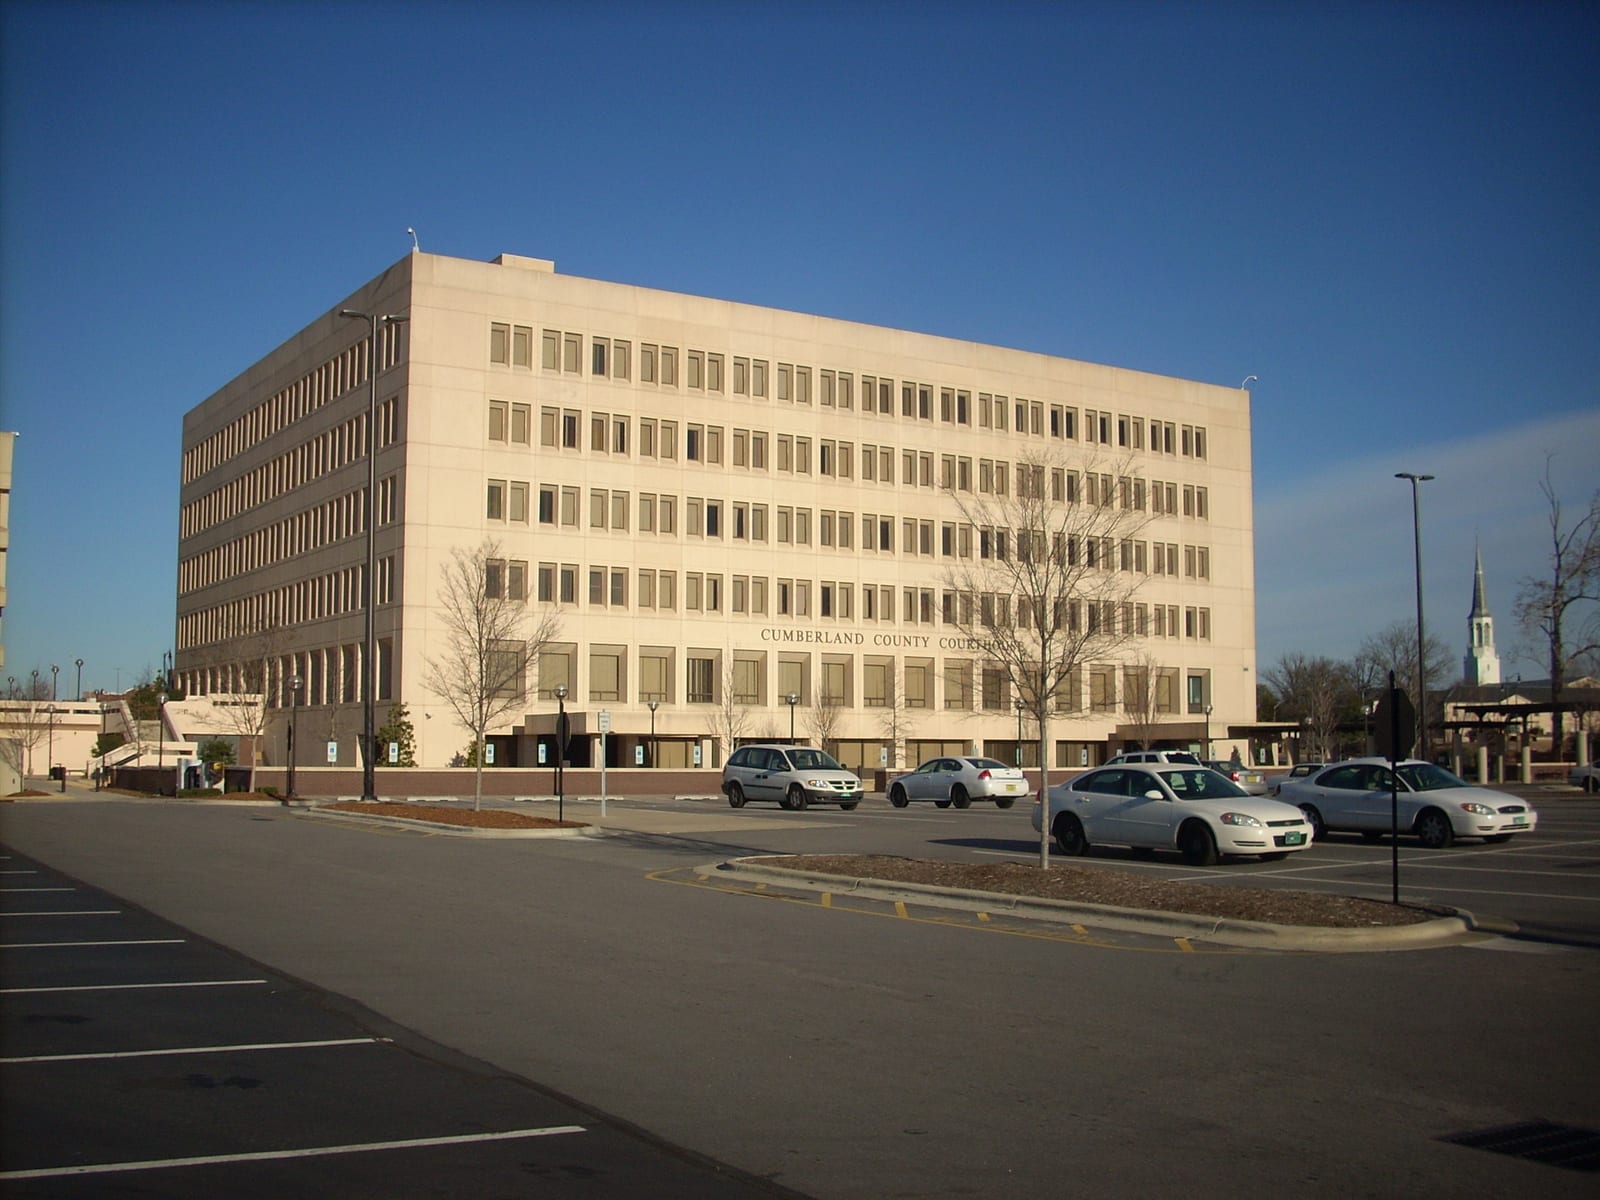
Cumberland County, North Carolina: Industrial Catholic Metro county. In 2024, voted D+13%. Democratic peak: D+73 in 1936.
Key facts
- 2024 presidential margin
- D+13MIT Election Lab
- Political typology
- Industrial Catholic MetroAkashic typology
- Population
- 338,5452024 5-year
- Median household income
- $61,2912024 5-year
- White (non-Hispanic)
- 42.4%2024 5-year
- Black
- 37.7%2024 5-year
- Hispanic / Latino
- 12.7%2024 5-year
- Peak Democratic margin
- D+73 in 1936MIT Election Lab
- Peak Republican margin
- R+42 in 1972MIT Election Lab
- Most similar
- Sacramento County, CA · similarity 0.96
| Kamala Harris ✓Democratic | 56.0% | 78,631 |
|---|---|---|
| Donald TrumpRepublican | 42.6% | 59,840 |
| OtherAll other candidates | 1.5% | 2,042 |
| Year | Margin (D minus R) |
|---|---|
| 1876 | No data |
| 1880 | No data |
| 1884 | No data |
| 1888 | No data |
| 1892 | +17.2% |
| 1896 | +6.5% |
| 1900 | −4.2% |
| 1904 | +17.0% |
| 1908 | +11.5% |
| 1912 | +51.7% |
| 1916 | +23.7% |
| 1920 | +24.2% |
| 1924 | +35.8% |
| 1928 | −3.5% |
| 1932 | +68.2% |
| 1936 | +72.8% |
| 1940 | +68.8% |
| 1944 | +53.3% |
| 1948 | +35.9% |
| 1952 | +8.4% |
| 1956 | +13.9% |
| 1960 | +17.9% |
| 1964 | +20.8% |
| 1968 | +2.8% |
| 1972 | −42.0% |
| 1976 | +26.0% |
| 1980 | +1.2% |
| 1984 | −16.5% |
| 1988 | −6.4% |
| 1992 | +4.9% |
| 1996 | +4.4% |
| 2000 | −0.6% |
| 2004 | −3.5% |
| 2008 | +17.7% |
| 2012 | +19.7% |
| 2016 | +16.0% |
| 2020 | +16.6% |
| 2024 | +13.4% |
| Year | Won | Margin | Democratic | Republican | Total |
|---|---|---|---|---|---|
| D | 78,631 | 59,840 | 140,513 | ||
| D | 84,469 | 60,032 | 147,150 | ||
| D | 71,605 | 51,265 | 127,506 | ||
| D | 75,792 | 50,666 | 127,641 | ||
| D | 74,693 | 52,151 | 127,575 | ||
| R | 45,788 | 49,139 | 95,226 | ||
| R | 38,129 | 38,626 | 77,151 | ||
| D | 32,739 | 29,804 | 66,479 | ||
| D | 30,291 | 27,139 | 64,470 | ||
| R | 23,789 | 27,057 | 50,979 | ||
| R | 22,614 | 31,602 | 54,319 | ||
| D | 22,073 | 21,540 | 45,228 | ||
| D | 24,297 | 14,226 | 38,683 | ||
| R | 9,853 | 24,376 | 34,595 | ||
| D | 9,938 | 9,143 | 28,620 | ||
| D | 13,864 | 9,093 | 22,957 | ||
| D | 11,601 | 8,072 | 19,673 | ||
| D | 8,862 | 6,699 | 15,561 | ||
| D | 8,839 | 7,474 | 16,313 | ||
| D | 4,996 | 1,741 | 9,062 | ||
| D | 6,615 | 2,014 | 8,629 | ||
| D | 6,050 | 1,118 | 7,168 | ||
| D | 6,505 | 1,024 | 7,529 | ||
| D | 5,012 | 931 | 5,983 | ||
| R | 3,297 | 3,534 | 6,831 | ||
| D | 2,923 | 1,372 | 4,332 | ||
| D | 3,233 | 1,972 | 5,205 | ||
| D | 1,971 | 1,217 | 3,188 | ||
| D | 1,678 | 235 | 2,793 | ||
| D | 1,832 | 1,453 | 3,285 | ||
| D | 1,594 | 1,129 | 2,729 | ||
| R | 1,964 | 2,138 | 4,113 | ||
| D | 2,509 | 2,200 | 4,745 | ||
| D | 2,178 | 1,333 | 4,906 | ||
| — | — | — | — | ||
| — | — | — | — | ||
| — | — | — | — | ||
| — | — | — | — |
Demographics
Cumberland County's large active-duty and veteran population surrounding Fort Liberty shapes an electorate that has backed Democratic presidential candidates by double digits in recent cycles, while its diverse workforce keeps turnout competitive across party lines.
Its margins are typically close. The Democratic margin reached seventy-three points in 1936; the Republican margin reached forty-two points in 1972. Between 2020 and 2024 the county moved three points toward the Republican candidate; the 2024 margin was thirteen points.
Its demographics sit near national norms: a 42% non-Hispanic-white share, a median household income of $61,291, and a 17% poverty rate. The county's voting pattern over the last decade is most similar to that of Sacramento County and Bernalillo County.
Compare two places, side by side
Twelve curated comparisons line up election history, demographics, and the divergence story for two places at a glance. Browse all comparisons →
Cumberland County, North Carolina. Akashic. https://akashic.app/county/37051/. Accessed May 20, 2026. License: CC BY 4.0.