Mahoning County, Ohio: Heartland Swing county. In 2024, voted R+9%. Republican peak: R+51 in 1924.
Key facts
- 2024 presidential margin
- R+9MIT Election Lab
- Political typology
- Heartland SwingAkashic typology
- Population
- 226,4912024 5-year
- Median household income
- $56,9422024 5-year
- White (non-Hispanic)
- 74.9%2024 5-year
- Black
- 14.0%2024 5-year
- Hispanic / Latino
- 6.8%2024 5-year
- Peak Democratic margin
- D+46 in 1964MIT Election Lab
- Peak Republican margin
- R+51 in 1924MIT Election Lab
- Most similar
- Carlton County, MN · similarity 0.99
| Donald Trump ✓Republican | 54.1% | 61,249 |
|---|---|---|
| Kamala HarrisDemocratic | 44.7% | 50,636 |
| OtherAll other candidates | 1.2% | 1,348 |
| Year | Margin (D minus R) |
|---|---|
| 1876 | No data |
| 1880 | No data |
| 1884 | No data |
| 1888 | No data |
| 1892 | +4.3% |
| 1896 | −11.4% |
| 1900 | −9.2% |
| 1904 | −34.4% |
| 1908 | −6.9% |
| 1912 | +4.8% |
| 1916 | +7.0% |
| 1920 | −31.8% |
| 1924 | −51.2% |
| 1928 | −28.3% |
| 1932 | −8.7% |
| 1936 | +44.1% |
| 1940 | +34.2% |
| 1944 | +33.2% |
| 1948 | +24.8% |
| 1952 | +12.0% |
| 1956 | −4.0% |
| 1960 | +22.5% |
| 1964 | +45.8% |
| 1968 | +20.6% |
| 1972 | −1.3% |
| 1976 | +23.6% |
| 1980 | +10.8% |
| 1984 | +17.6% |
| 1988 | +26.5% |
| 1992 | +26.7% |
| 1996 | +35.0% |
| 2000 | +25.2% |
| 2004 | +25.9% |
| 2008 | +26.5% |
| 2012 | +28.0% |
| 2016 | +3.2% |
| 2020 | −1.9% |
| 2024 | −9.4% |
| Year | Won | Margin | Democratic | Republican | Total |
|---|---|---|---|---|---|
| R | 50,636 | 61,249 | 113,233 | ||
| R | 57,641 | 59,903 | 118,966 | ||
| D | 57,381 | 53,616 | 117,636 | ||
| D | 77,059 | 42,641 | 122,801 | ||
| D | 79,173 | 45,319 | 127,659 | ||
| D | 83,194 | 48,761 | 132,904 | ||
| D | 69,212 | 40,460 | 114,119 | ||
| D | 72,716 | 31,397 | 118,178 | ||
| D | 64,731 | 31,191 | 125,650 | ||
| D | 75,524 | 43,722 | 120,126 | ||
| D | 76,514 | 53,424 | 131,438 | ||
| D | 63,677 | 50,153 | 125,161 | ||
| D | 75,837 | 46,314 | 125,294 | ||
| R | 62,428 | 64,144 | 129,088 | ||
| D | 68,433 | 42,948 | 123,578 | ||
| D | 90,934 | 33,775 | 124,709 | ||
| D | 82,143 | 51,927 | 134,070 | ||
| R | 59,126 | 63,992 | 123,118 | ||
| D | 67,722 | 53,164 | 120,886 | ||
| D | 62,468 | 37,365 | 101,146 | ||
| D | 70,102 | 35,184 | 105,286 | ||
| D | 76,441 | 37,496 | 113,937 | ||
| D | 64,886 | 24,825 | 90,858 | ||
| R | 33,139 | 39,713 | 75,861 | ||
| R | 26,928 | 48,341 | 75,748 | ||
| R | 9,335 | 37,647 | 55,264 | ||
| R | 14,941 | 29,736 | 46,570 | ||
| D | 13,013 | 11,256 | 25,225 | ||
| O | 6,838 | 5,839 | 20,703 | ||
| R | 9,312 | 10,760 | 21,023 | ||
| R | 4,436 | 10,404 | 17,350 | ||
| R | 7,402 | 8,939 | 16,686 | ||
| R | 6,772 | 8,529 | 15,432 | ||
| D | 6,358 | 5,806 | 12,750 | ||
| — | — | — | — | ||
| — | — | — | — | ||
| — | — | — | — | ||
| — | — | — | — |
Demographics
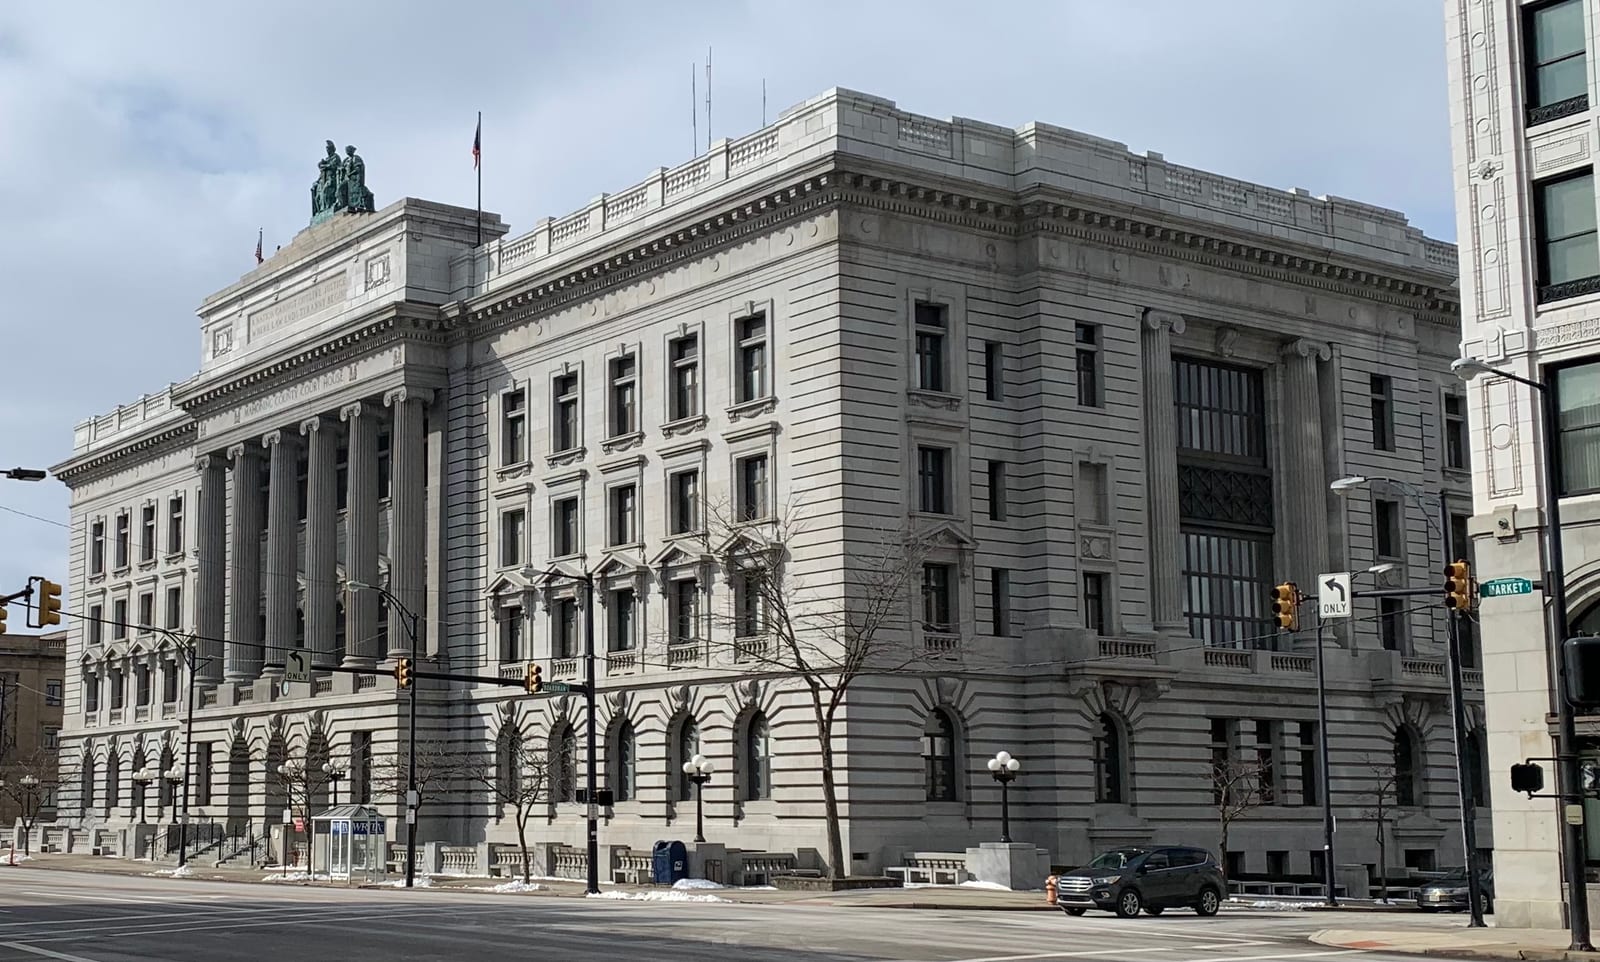
Mahoning County, anchored by Youngstown, spent decades as one of Ohio's most reliably Democratic counties; since 2016 it has shifted sharply, posting an R+9.4 margin in 2024 after deindustrialization reshaped its working-class electorate.
The Democratic margin here peaked at forty-six points in 1964. Between 2020 and 2024 the county moved seven points toward the Republican candidate; the 2024 margin was nine points.
A population of 226,491, a 75% non-Hispanic-white share, and a median household income of $56,942 describe the county. The county's voting pattern over the last decade is most similar to that of Carlton County and Mower County.
Compare two places, side by side
Twelve curated comparisons line up election history, demographics, and the divergence story for two places at a glance. Browse all comparisons →
Mahoning County, Ohio. Akashic. https://akashic.app/county/39099/. Accessed May 20, 2026. License: CC BY 4.0.