Davison County, South Dakota: Farm Belt county. In 2024, voted R+38%. Republican peak: R+47 in 1904.
Key facts
- 2024 presidential margin
- R+38MIT Election Lab
- Political typology
- Farm BeltAkashic typology
- Population
- 19,9522024 5-year
- Median household income
- $66,2082024 5-year
- White (non-Hispanic)
- 89.8%2024 5-year
- Black
- 0.7%2024 5-year
- Hispanic / Latino
- 5.1%2024 5-year
- Peak Democratic margin
- D+45 in 1912MIT Election Lab
- Peak Republican margin
- R+47 in 1904MIT Election Lab
- Most similar
- Edmunds County, SD · similarity 0.99
| Donald Trump ✓Republican | 67.6% | 6,208 |
|---|---|---|
| Kamala HarrisDemocratic | 29.9% | 2,743 |
| OtherAll other candidates | 2.5% | 226 |
| Year | Margin (D minus R) |
|---|---|
| 1876 | No data |
| 1880 | No data |
| 1884 | No data |
| 1888 | No data |
| 1892 | −33.8% |
| 1896 | +8.6% |
| 1900 | −4.2% |
| 1904 | −47.4% |
| 1908 | −7.8% |
| 1912 | +45.3% |
| 1916 | +4.7% |
| 1920 | −31.2% |
| 1924 | −41.0% |
| 1928 | −16.6% |
| 1932 | +41.3% |
| 1936 | +31.7% |
| 1940 | +7.2% |
| 1944 | +4.8% |
| 1948 | +15.0% |
| 1952 | −19.3% |
| 1956 | −3.1% |
| 1960 | +0.0% |
| 1964 | +27.1% |
| 1968 | −3.7% |
| 1972 | +10.7% |
| 1976 | +10.0% |
| 1980 | −19.2% |
| 1984 | −19.1% |
| 1988 | −4.1% |
| 1992 | +2.1% |
| 1996 | −0.1% |
| 2000 | +20.0% |
| 2004 | −25.7% |
| 2008 | −13.9% |
| 2012 | −21.5% |
| 2016 | −35.2% |
| 2020 | −35.1% |
| 2024 | −37.8% |
| Year | Won | Margin | Democratic | Republican | Total |
|---|---|---|---|---|---|
| R | 2,743 | 6,208 | 9,177 | ||
| R | 2,648 | 5,613 | 8,454 | ||
| R | 2,355 | 5,157 | 7,952 | ||
| R | 3,042 | 4,757 | 7,971 | ||
| R | 3,554 | 4,731 | 8,455 | ||
| R | 3,263 | 5,561 | 8,952 | ||
| D | 4,445 | 2,936 | 7,528 | ||
| R | 3,364 | 3,371 | 7,528 | ||
| D | 3,285 | 3,111 | 8,146 | ||
| R | 3,705 | 4,024 | 7,786 | ||
| R | 3,248 | 4,783 | 8,048 | ||
| R | 3,107 | 4,743 | 8,512 | ||
| D | 4,510 | 3,688 | 8,248 | ||
| D | 4,710 | 3,796 | 8,531 | ||
| R | 3,585 | 3,869 | 7,719 | ||
| D | 4,861 | 2,789 | 7,650 | ||
| D | 4,108 | 4,105 | 8,213 | ||
| R | 3,809 | 4,056 | 7,865 | ||
| R | 3,227 | 4,774 | 8,001 | ||
| D | 4,064 | 2,996 | 7,128 | ||
| D | 3,222 | 2,929 | 6,151 | ||
| D | 4,230 | 3,659 | 7,889 | ||
| D | 4,983 | 2,510 | 7,805 | ||
| D | 5,233 | 2,147 | 7,480 | ||
| R | 2,729 | 3,821 | 6,571 | ||
| R | 578 | 2,801 | 5,417 | ||
| R | 1,105 | 2,605 | 4,810 | ||
| D | 1,516 | 1,374 | 3,003 | ||
| O | 1,266 | 0 | 2,796 | ||
| R | 1,081 | 1,276 | 2,506 | ||
| R | 506 | 1,626 | 2,362 | ||
| R | 782 | 853 | 1,697 | ||
| D | 733 | 616 | 1,365 | ||
| O | 120 | 569 | 1,329 | ||
| — | — | — | — | ||
| — | — | — | — | ||
| — | — | — | — | ||
| — | — | — | — |
Demographics
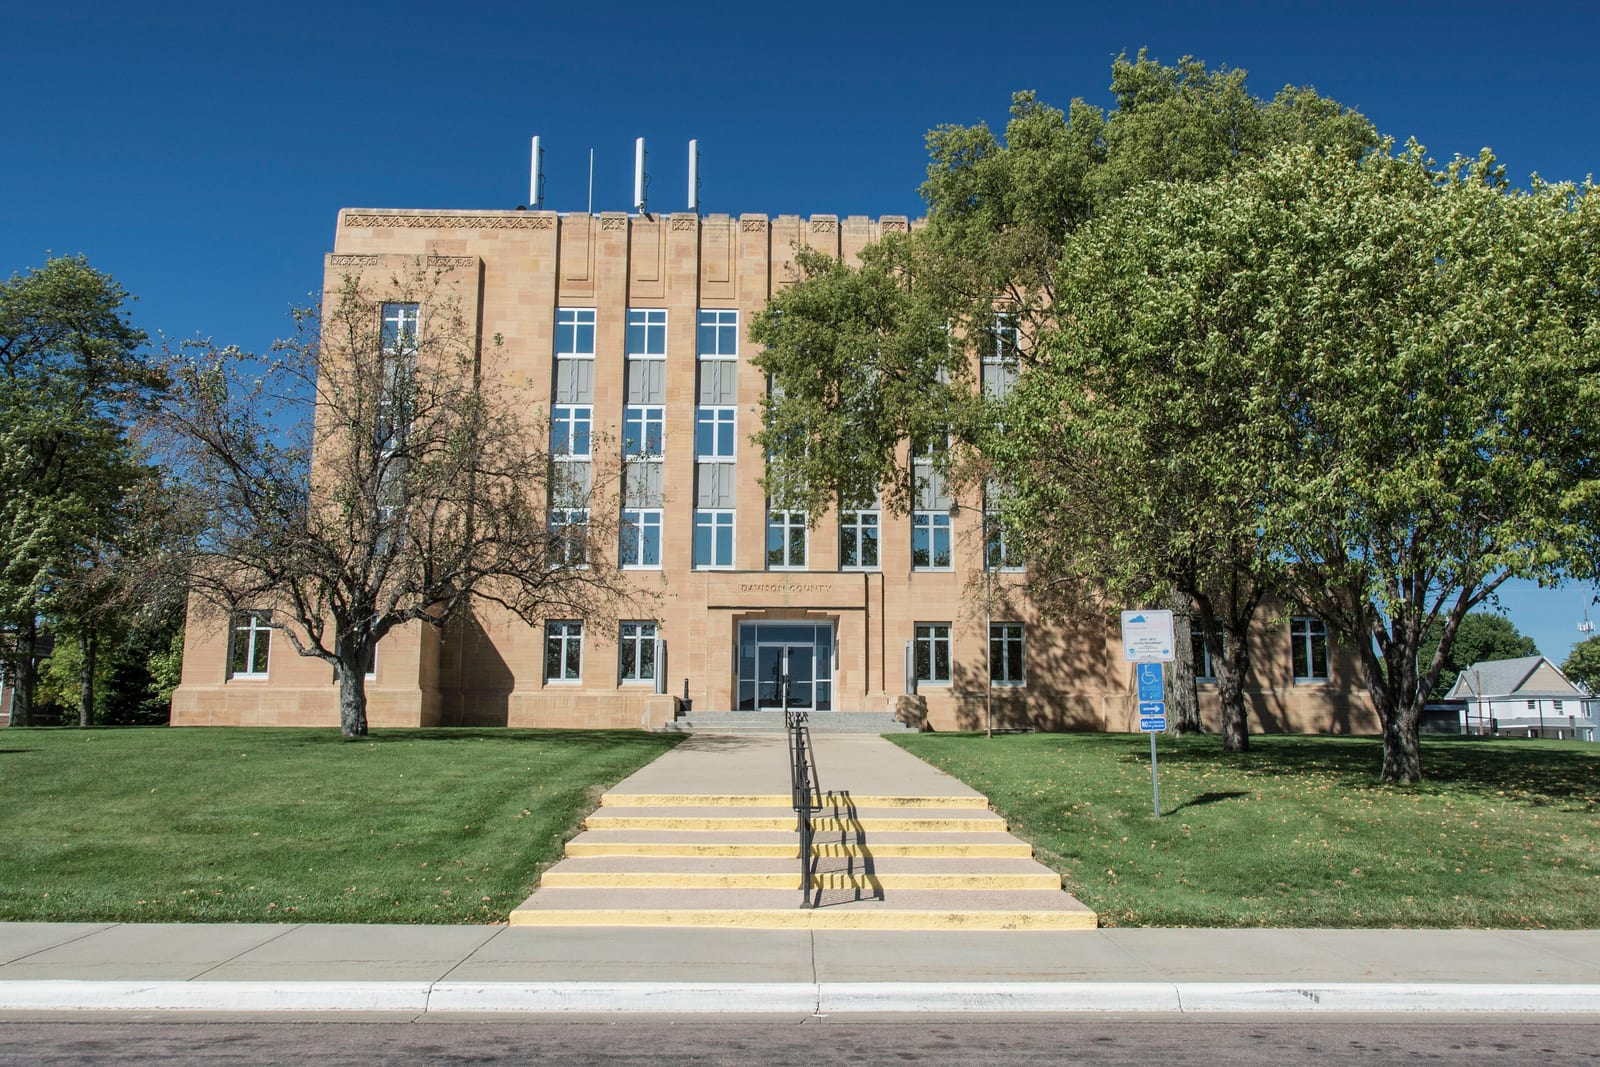
Davison County punches above its size as home to Mitchell, the largest city in south-central South Dakota, giving it a modest service-sector economy in an otherwise agrarian region that has voted Republican by wide margins for decades.
The Republican margin here reached forty-seven points in 1904. Between 2020 and 2024 the county moved three points toward the Republican candidate; the 2024 margin was thirty-eight points.
A population of 19,952, a 90% non-Hispanic-white share, and a median household income of $66,208 describe an agricultural county. The county's voting pattern over the last decade is most similar to that of Edmunds County and Pamlico County.
Compare two places, side by side
Twelve curated comparisons line up election history, demographics, and the divergence story for two places at a glance. Browse all comparisons →
Davison County, South Dakota. Akashic. https://akashic.app/county/46035/. Accessed May 20, 2026. License: CC BY 4.0.